2. Overview of SpeeDBee Synapse
This chapter explains the features, configuration, and operational flow of SpeeDBee Synapse.
2.1 Features of SpeeDBee Synapse#
SpeeDBee Synapse can collect data from various devices (PLC, etc.) that constitute FA and IoT. Collected data can be converted, analyzed, and linked with other systems by using various functions of SpeeDBee Synapse. This enables you to build a system that achieves everything from data collection to data utilization.

2.2 Configuration of SpeeDBee Synapse#
SpeeDBee Synapse consists of four main functions.
| Function name | Description |
|---|---|
| Core | This is the central part that controls the overall functionality of the collection engine. |
| Component | This is a group of modules that realize data collection, processing, analysis and transmission. Various functions can be realized by connecting components. |
| Time series database | This is a database that stores collected data in line with time. |
| WEBUI | This is the user interface for setting various functions and visualizing data. |
Components are organized into eight categories. The following table lists the components that belong to each category.
| Category | Name | Description |
|---|---|---|
| Collector | - | Provides data collection functionality. This is the starting point for using various functions after data collection. |
| EtherNet/IP | Collects data from EtherNet/IP-enabled devices. | |
| PLC | Collects data from PLC register/variable information. | |
| Modbus | Collects data from Modbus compatible devices. | |
| MQTT | Data collection is performed using the MQTT protocol (Subscribe). | |
| Resources | Collect system resources (CPU usage, memory consumption, etc.) in the operating machine. | |
| Compute Collector | Registers the result of a calculation that uses collected data as new separate data. | |
| Emitter | - | Provides data output or data transmission functionality. You can use this information to link with external systems. |
| Cloud for Azure | Sends data to Azure IoT Hub. | |
| MQTT | Sends data using the MQTT protocol (Publish). | |
| FTP/FTPS/SFTP | Transfers data via FTP, FTPS or SFTP. | |
| File | Saves the collected data as a file to storage. | |
| Cloud (for AWS) | Sends data to AWS IoT Core. | |
| Serializer | - | Processes data into the specified format. |
| CSV | Processes data into CSV format. | |
| JSON | Processes the specified data into JSON format. | |
| Deserializer | - | The specified format is processed into data. |
| JSON | Processes the specified data in JSON format. | |
| Action | - | Provides any action that uses the collected data. |
| Shell Command | Execute any shell command that uses the collected data. | |
| Send email | Sends an email using the collected data. | |
| Modbus Writing | Writes a value to the specified address of a Modbus compatible device. | |
| PLC Writing | Writes a value to the specified address of the PLC. | |
| EtherNet/IP Writing | Writes a value to an EtherNet/IP device. | |
| Logic | - | Provides real-time analysis and decision processing of collected data. |
| Event data | The collected data is judged against the condition, and only when the conditions are met, it is newly registered as other data. | |
| Event trigger | Collected data is judged against the condition and the information on sections that meet the conditions is provided. | |
| Basic Stats | Registers the result of statistical processing that uses collected data as new separate data. | |
| Moving average | Registers the moving average of the collected data as data. | |
| FFT | Registers the result of FFT of collected data as data. (Frequency, Intensity) | |
| System | - | Provides functionality related to the system. |
| DB query service | You can query the data collected in SpeeDBee Synapse. Also used for Grafana linkage. | |
| Core internal | This is the component that manages internal status within SpeeDBee Synapse. | |
| Error manager | This component can detect all errors that occur within SpeeDBee Synapse. | |
| Custom (C) | - | This is a component composed of programs designed by the user in Python or C. You can add various functions that are not possible with standard components. |
2.3 Flow up to operation#
The basic flow up to the operation of SpeeDBee Synapse is as follows.
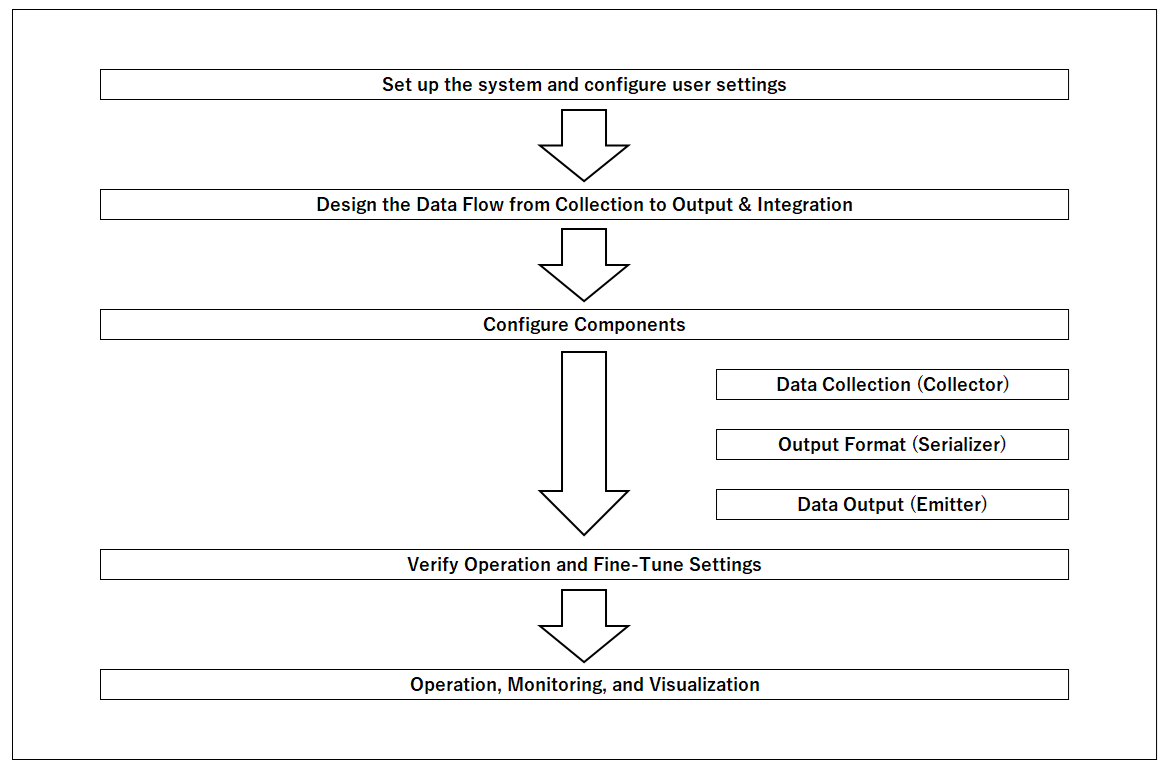
① Setting Up of a Setup User
Refer to this manual to set up SpeeDBee Synapse. In addition, it sets up the users according to their privileges.
② Study the flow from data collection to output and linkage
Depending on the purpose of the system, what data is to be actually collected and the equipment to be used are selected and examined. In addition, it designs the format in which the collected data will ultimately be outputted and utilized. Checks the supported features such as collectors, serializers, emitters, etc. to be used. At this stage, if you need an unsupported protocol, consider developing a custom component.
③Setting of Components
Configure the various components according to the flow examined. The basic flow is to set up in the order of data collection, processing and output.
- Data Collection Configuration (Collector)
Configures data collection settings. Make sure that the source device and its settings are correct. Then you actually configure the components.
- Setting the Output Format (Serializer)
Configures data output format settings. Set up either CSV or JSON. You can also set the units in which the output file is divided.
- Data Output Settings (Emitters)
Specifies how output data is to be processed in the final result. For example, since the File emitter saves the output file to storage, it sets up where to save it. To send data to an external device, check the information required for external connection and make settings.
④ Operation check and setting tuning
Verify that each configured component is operating correctly. Make sure that data has been collected normally, that data has been outputted in the specified format, and that the transmission has been successfully done. If there is an unintended operation, review the settings, change the settings, and check again.
⑤ Operation, monitoring and visualization
Actually operate the system. You can monitor data and visualize graphs using the features provided by the Data Exploitation Engine. If a problem occurs during operation, reconsider and perform configuration tuning again.
In addition, you can configure a system that utilizes SpeeDBee Synapse by setting up real time analysis and event linkage according to the purpose.