5.3 Linking with Grafana
5.3.1 Grafana Integration Overview#
Grafana is a tool for visualizing system data.
By working with Grafana, you can create graphs using data collected by SpeeDBee Synapse.
You can connect a single SpeeDBee Synapse to multiple Grafana to create dashboards, and you can also create multiple dashboards within a single Grafana.

For more information about Grafana, visit the official website.
Notes
Version 11.5.2 of Grafana is used in the explanations in this chapter. There may be differences in operations depending on the version.
In the SpeeDBee Synapse Grafana integration feature, the data source, folder, and dashboard in Grafana are created automatically. Since these resources are managed and updated by Synapse, please do not modify them manually from the Grafana interface. If you modify and save them, any user-made changes will be overwritten when Synapse performs an update operation in Grafana. If you prefer to manage these resources manually, please create the data source, folder, and dashboard yourself.
5.3.2 Installing Grafana#
- Perform this procedure in an environment in which Grafana is installed.
- The following Linux procedures use sudo for all operations that require system administration privileges.
- In Linux, to operate as a user with root privileges, enter the command without sudo.
- On Windows, start Windows PowerShell with “Run as administrator.”
- For the administrator privileges, consult the system administrator of the OS.
In the Data Flow Controller version, Grafana is pre-installed by default, so no installation is required.
-
Install Grafana. For the installation procedure, refer to the official website.
-
Execute the following command to create the directory to which the plug-in is to be installed:
$ sudo mkdir -p /var/lib/grafana/plugins/SpeeDBSynapse/PS >New-Item -ItemType Directory -Path "C:\Program Files\GrafanaLabs\grafana\data\plugins\SpeeDBeeSynapse" -Force$ sudo mkdir -p <Destination directory>/grafana-9.1.3/data/plugins/SpeeDBeeSynapse/ -
Place "synapse_gplugin.tar.gz" in a directory of your choice.
"synapse_gplugin.tar.gz" is a plug-in for linking Grafana and SpeeDBee Synapse. It is distributed together with the installer of SpeeDBee Synapse. If you have any questions, feel free to contact us.
Contact Form: https://www.saltyster.com/contact/
-
Execute the following commands to move to the directory where you located "synapse_gplugin.tar.gz":
$ cd <The directory where synapse_gplugin.tar.gz is located>PS >cd <The directory where synapse_gplugin.tar.gz is located>$ cd <The directory where synapse_gplugin.tar.gz is located> -
Execute the following command to install the plug-in:
$ sudo tar xzf synapse_gplugin.tar.gz -C /var/lib/grafana/plugins/SpeeDBSynapse/PS >tar xzf synapse_gplugin.tar.gz -C "C:\Program Files\GrafanaLabs\grafana\data\plugins\SpeeDBeeSynapse"$ sudo tar xzf synapse_gplugin.tar.gz -C <Destination directory>/grafana-9.1.3/data/plugins/SpeeDBeeSynapse/ -
Restart Grafana by executing the following commands:
$ sudo systemctl restart grafana-serverPS >Restart-Service grafana$ cd < Destination directory >/grafana-9.1.3 $ sudo ./bin/grafana-serverService registration to systemd
If you want to start a service with systemctl, follow the procedure below to register the service with systemd.
-
Creating Service Unit File
/lib/systemd/system/grafana-server.service[Unit] Description=Grafana server [Service] Type=simple WorkingDirectory=<Destination directory>/grafana-9.1.3 ExecStart=<Destination directory>/grafana-9.1.3/bin/grafana-server Restart=on-failure [Install] WantedBy=multi-user.target -
Load the service to systemd and start the service.
$ sudo systemctl daemon-reload
$ sudo systemctl start grafana-server
-
5.3.3 Basic Information for Grafana Integration#
To integrate with Grafana, you need to configure the “destination” settings and the “dashboard.”
-
Destination
When integrating SpeeDBee Synapse with Grafana, this is the setting that specifies which Grafana to communicate with.
-
Dashboard
This is the setting for visualizing the data collected by SpeeDBee Synapse on a single screen.
A dashboard is created for the specified destination.
5.3.4 Destination#
Before proceeding with this procedure, you must have completed "Installing Grafana."
5.3.4.1 Adding Destination#
-
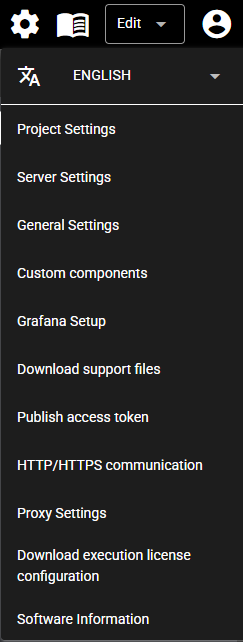
Open the Edit mode screen of SpeeDBee Synapse.
-
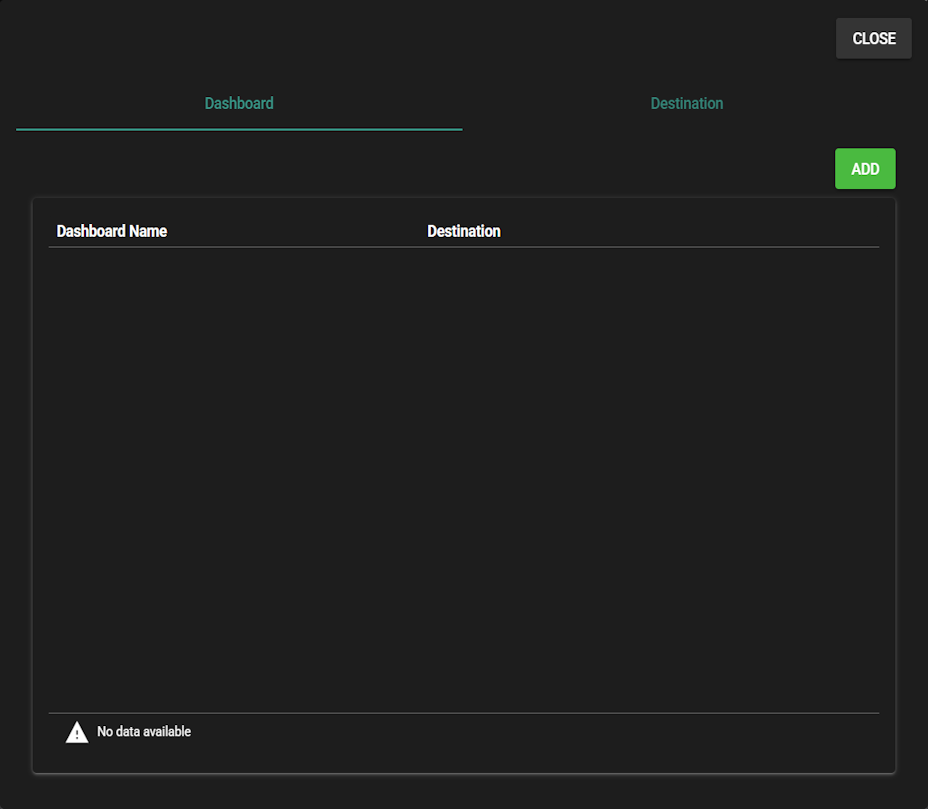
Press the Setting Menu icon and choose “Grafana Setup.”
-
The dashboard settings list will open. For details about dashboard settings, see Dashboard.
-
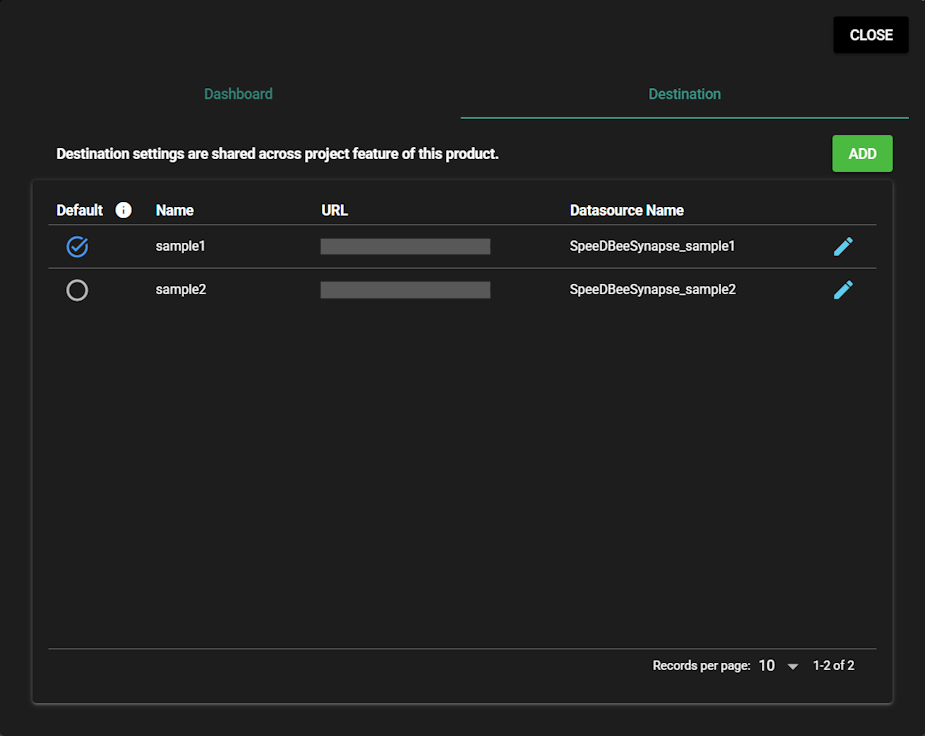
Press the “Destination” tab to display the list of destination settings.
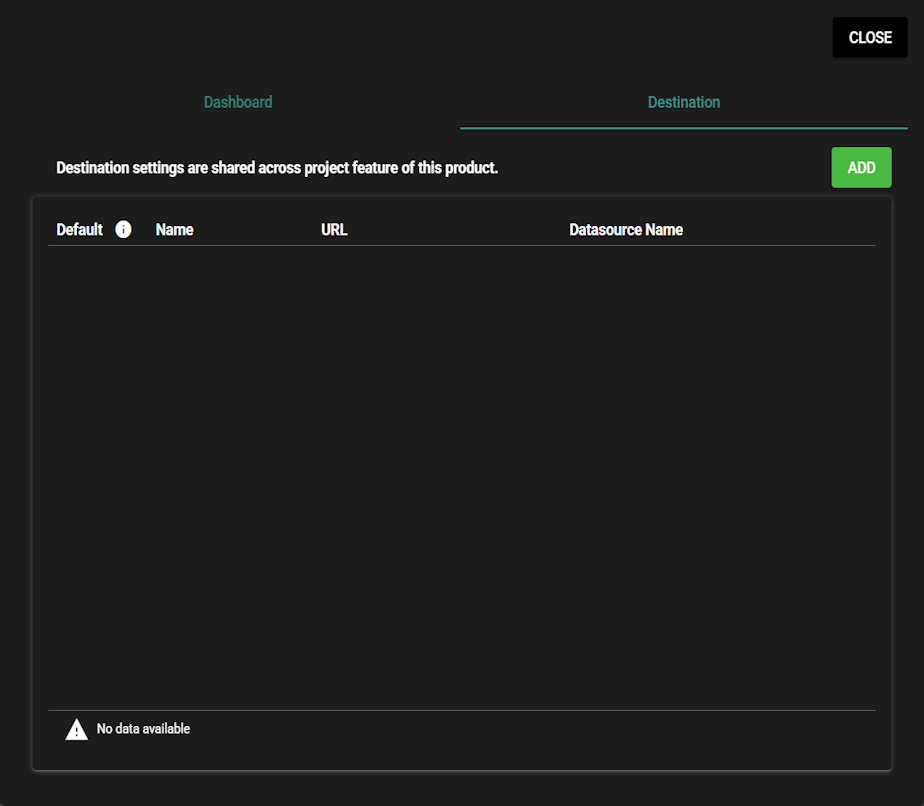
Item Description Default Default destination (used as the target when navigating from the graph icon in the header) Name Destination name used in the destination list URL URL of the Grafana to connect to Datasource Name Data source name used in Grafana -
Press “Add.”
-
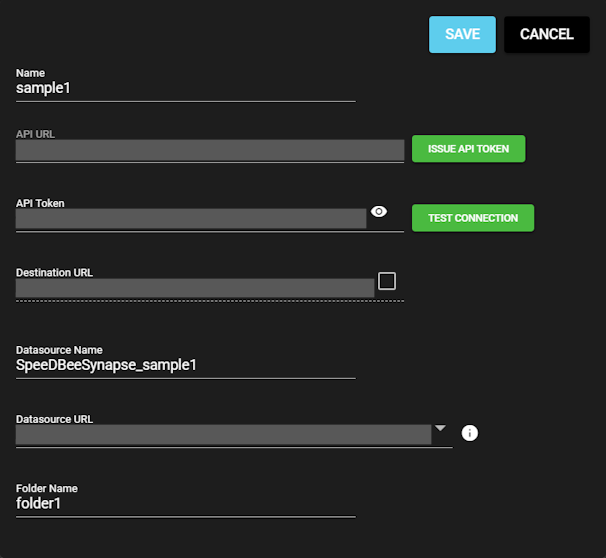
Detailed destination settings will open, and you can enter the information.
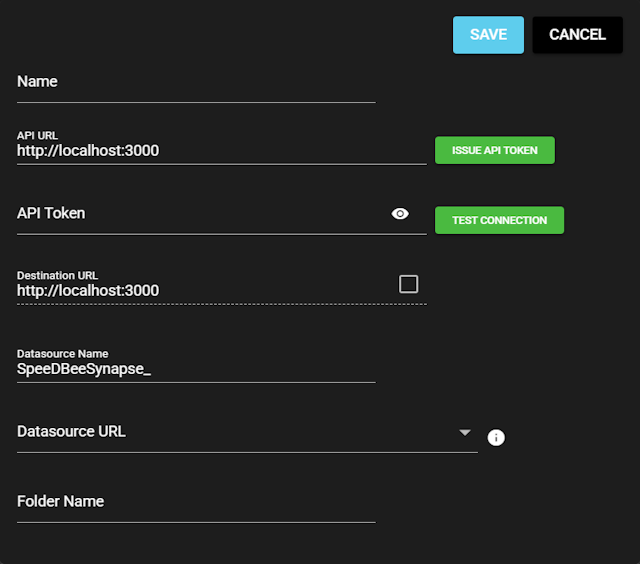
Item Description Name Displayed in the destination settings list.
Enter any desired text.API URL Enter the URL of the Grafana you want to connect to. API Token This is the token used when connecting to Grafana.
If you already have one, enter it directly.
If not, you can generate one using the “ISSUE API TOKEN” button.
For details, see “API Token Issuance Process.”Destination URL Enter the URL used for navigation from the graph icon in the header at the top of the screen.
This is normally the same as the API URL, so no changes are required.
If you need to modify it, enable the checkbox to make the field editable.Datasource Name This is the data source name used in Grafana.
Normally, it reflects the value entered in the Name field, so no changes are required.
If you want to modify it, enter any desired text.Datasource URL This is the URL that Grafana uses to access this software’s DB query endpoint.
Select a URL from the list, or enter one manually if none of the options apply.
Example: http://127.0.0.1:8081/dbquery
The IP address must be one that Grafana can use to reach this software.
For details, see “DB Query Service” and “DB Query Service Web API Specification”.Folder Name This is the folder name used in Grafana dashboards. Enter any desired text. Enter the URL of the Grafana you want to connect to, then press “Issue API Token.”

The following dialog appears. After entering the required fields, press “Issue.”
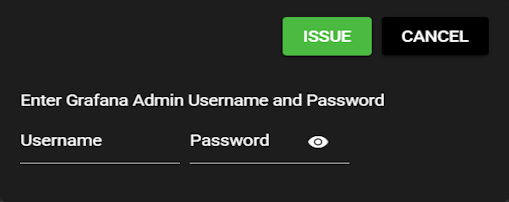
Item Description Username Username required to log in to Grafana
Note: The default value is "admin."Password Password required to log in to Grafana
Note: The default value is "admin."When the setup is completed, the API token will be filled in automatically.
You can also press “Test Connection” to display the validation result on the right side.
-
Press “Save.”
-
After pressing “Save,” the following validations are performed for the access token, data source, and folder.
・The access token registered in the data source
・If no data source exists, whether the configured data source name is already in use
・If no folder exists, whether the configured folder name is already in useIf the validation fails, a dialog like the one shown in the image will appear.
When the dialog appears, adjust your input values as needed and press “Update.”Note: If the validation succeeds, you can skip this step.
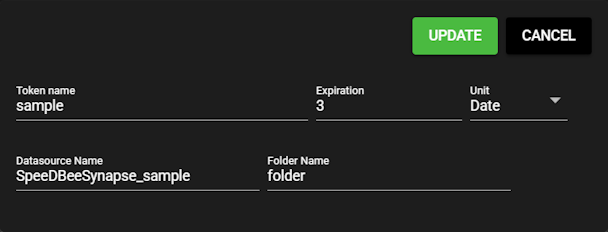
Item Description Token Name The token name you want to assign when issuing a new token Expiration Token validity period Unit The unit for the value entered in “Expiration” Datasource Name The data source name to use when creating a new data source Folder Name The folder name to use when creating a new folder -
If you generate a new access token, a dialog will appear. Press “Yes.”
Note: If you generate a new access token and update it, you will need to update the settings of the DB query service and restart it. If you need to update and start DB query service manually, see “Starting DB Query Service.”
If you did not generate a new access token, you can skip this step.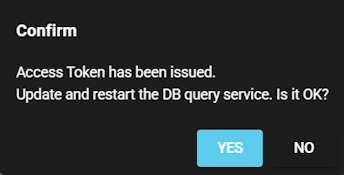
-
-
You can confirm that the destination you just configured has been added to the destination list.

5.3.4.2 Modifying or Deleting Destination#
Edit
You can edit a destination settings by following the steps below.
-
Open the destination list and press the edit icon.

-
Enter the following items and press “Save.”
For details on each item, see “Adding Destination.”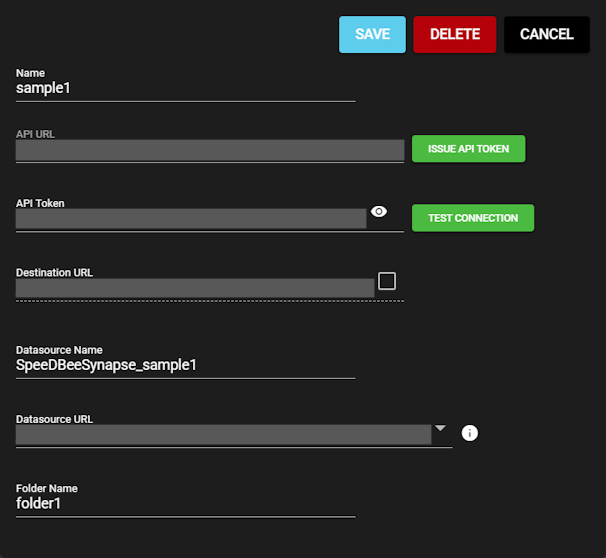
Default Destination
You can set the default destination by following the steps below.
The URL set as the default destination will be used as the target when navigating from the graph icon in the header.
-
Open the destination settings list and check the destination you want to set as the default.
-
Note: Pressing a destination that is already set as the default will unset it as the default destination.
Delete
You can delete destination settings by following the steps below.
-
Open the destination list and press the edit icon.
-
Press “Delete.”
Note: If the destination settings you are deleting is associated with any resources on the Grafana side, those resources will also be removed when you delete the destination settings.
5.3.5 Dashboard#
5.3.5.1 Adding Dashboard#
-
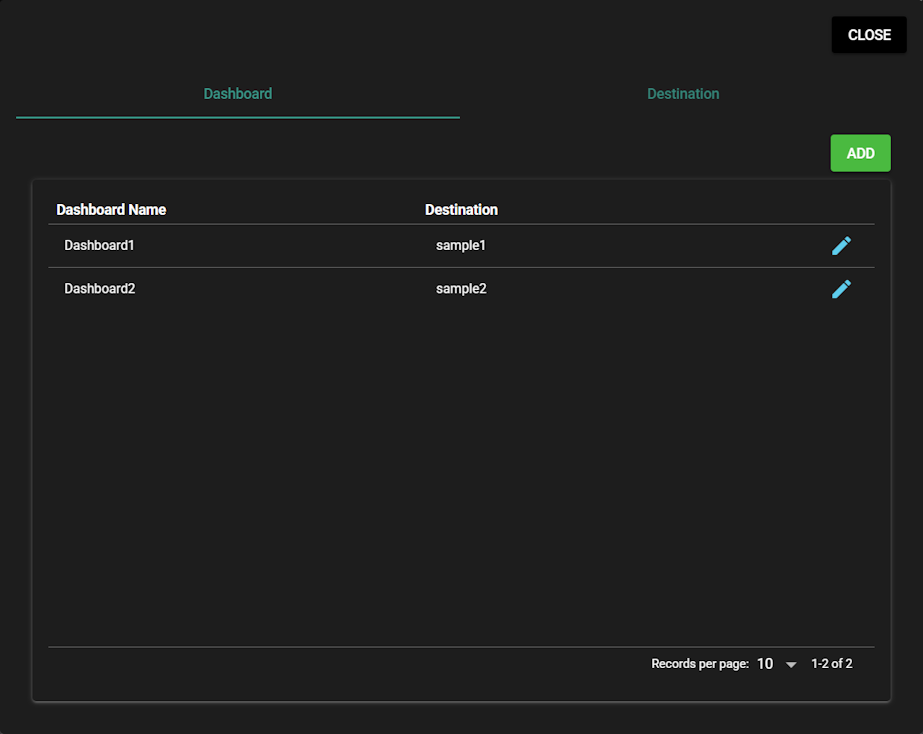
Press the “Dashboard” tab to display the list of Dashboard settings.
Item Description Dashboard Name Dashboard name used in the dashboard list Destination The destination used by the dashboard -
Press “Add.”
-
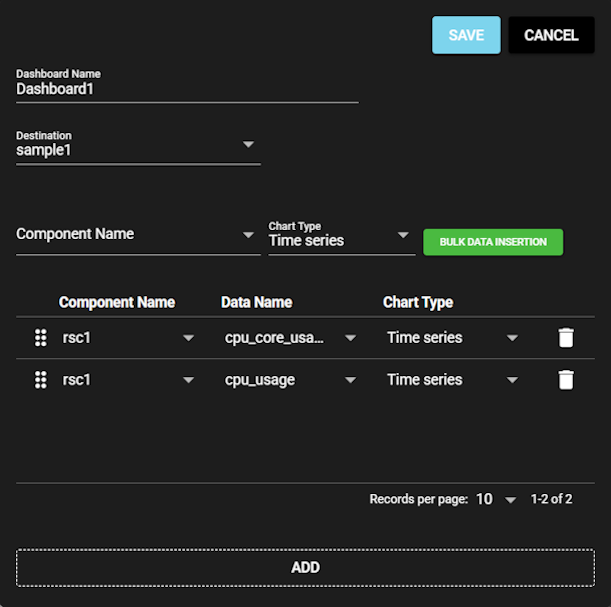
Detailed dashboard settings will open, and you can enter the information.
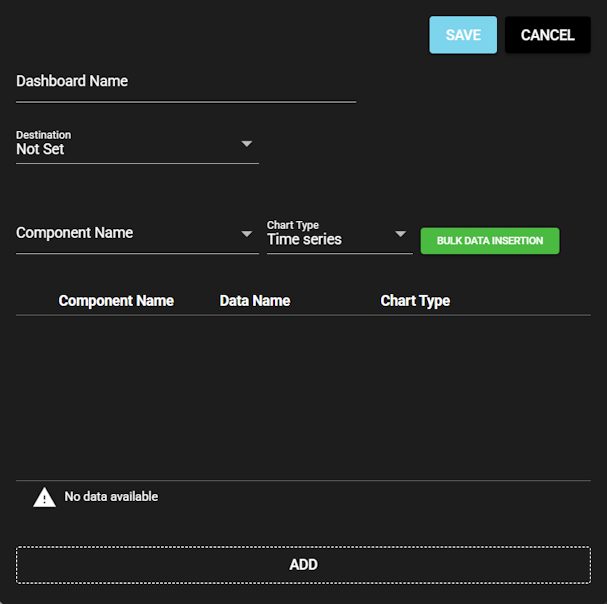
Item Description Dashboard Name This will be displayed in the dashboard settings list and as the dashboard name in Grafana.
Enter any desired text.Destination This is the destination used by the dashboard.
Select the destination configured in “Destination.”
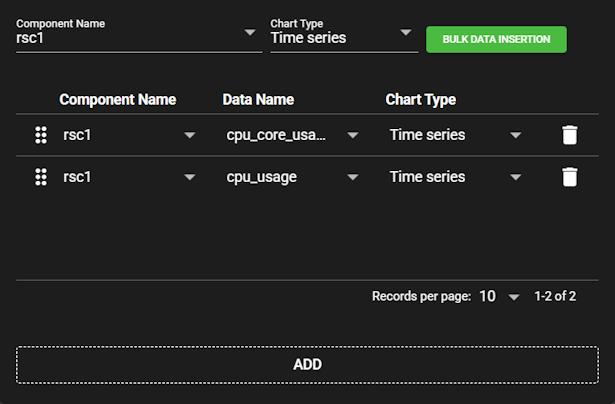
If the destination is set to “Not Set”, it will not integrate with Grafana and will only be added to the dashboard settings list.Component Name This is the component name used by the “Bulk Data Insertion” feature.
For details, see “Bulk Data Insertion.”Chart Type This is the chart type used by the “Bulk Data Insertion” feature.
For details, see “Bulk Data Insertion.”The dashboard displayed in Grafana is configured using the items in the table shown in the lower half of the image.
Pressing “Add” will add a new row.
Note: when multiple rows exist, you can reorder them by dragging the icon on the left.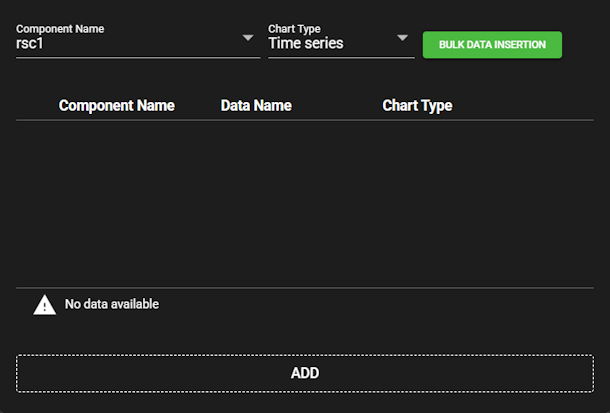
Item Description Component Name This is the component name displayed in the Grafana dashboard.
You can select it with a left-click, and manual input is also available.Data Name This is the name of the data output by the component.
You can select it with a left-click, and manual input is also available.
You can select the data name output by the component in the same row.Chart Type This is the chart type displayed in the Grafana dashboard.
Select the graph type you want to configure.The available chart types are as follows.
Chart Type Description Example Time series Displays values over time. 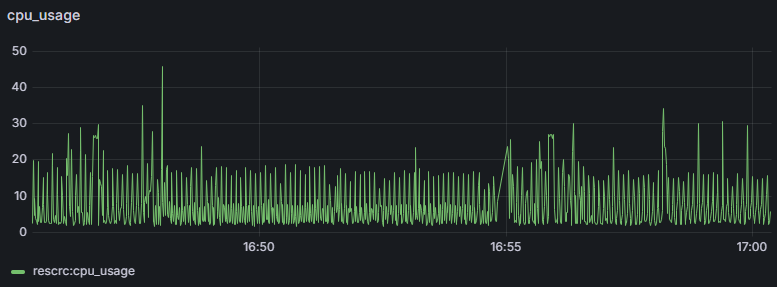
Stat Displays the current value over a background line chart. 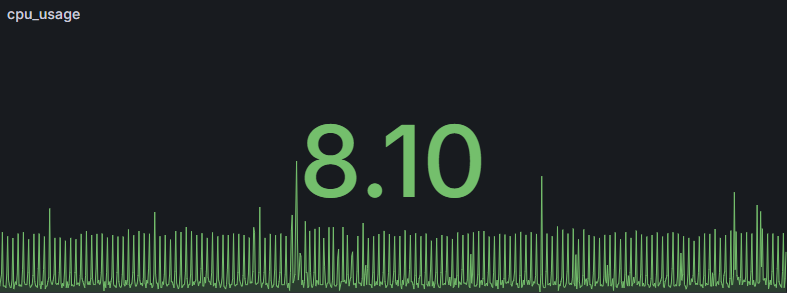
Table Displays values in a table format. 
Histogram Calculates the distribution of values and displays it as a bar chart. 
Unselected The default value when selecting a chart type. It cannot be saved while unselected. Select the component and chart type, then press “Bulk Data Insertion.”
All data output by the selected component will be added at once using the selected chart type.
-
Press “Save.”
-
As with the destination settings, pressing “Save” validates the access token, data source, and folder. (For details, see “Destination.”)
If this dialog appears, adjust your input values as needed and press “Update.”
Note: If the validation succeeds, you can skip this step.
-
If you generate a new access token, a dialog will appear. Press “Yes.”
Note: If you generate a new access token and update it, you will need to update the settings of the DB query service and restart it. If you need to update and start DB query service manually, see “Starting DB Query Service.”
If you did not generate a new access token, you can skip this step.
-
-
You can confirm that the dashboard you just configured has been added to the dashboard settings list.

5.3.5.2 Modifying or Deleting Dashboard#
Edit
You can edit a dashboard settings by following the steps below.
-
Open the dashboard settings list and press the edit icon.
-
Enter the following items and press “Save.”
For details on each item, see “Adding Dashboard.”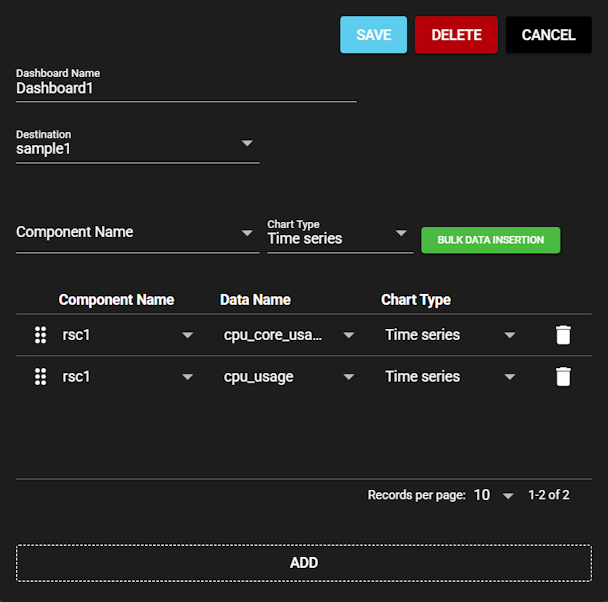
Delete
You can delete dashboard settings by following the steps below.
-
Open the dashboard settings list and press the edit icon.
-
Press “Delete.”
Note: If the destination settings you are deleting is associated with any resources on the Grafana side, those resources will also be removed when you delete the destination settings.
5.3.6 Checking in Grafana#
Check the configured destination and dashboard in Grafana.
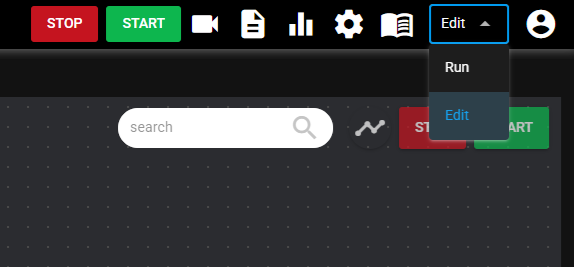
-
Press the graph icon in the header to open Grafana.

-
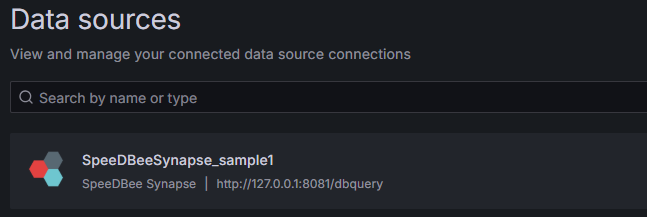
Press “Data sources” in the left menu.
-
You can confirm that the destination configured in “Destination” has been registered as a data source.
-
Press “Dashboards” in the left menu.

-
The folder configured in “Destination” exists, so select it.

-
Select the dashboard configured in “Dashboard”.
-
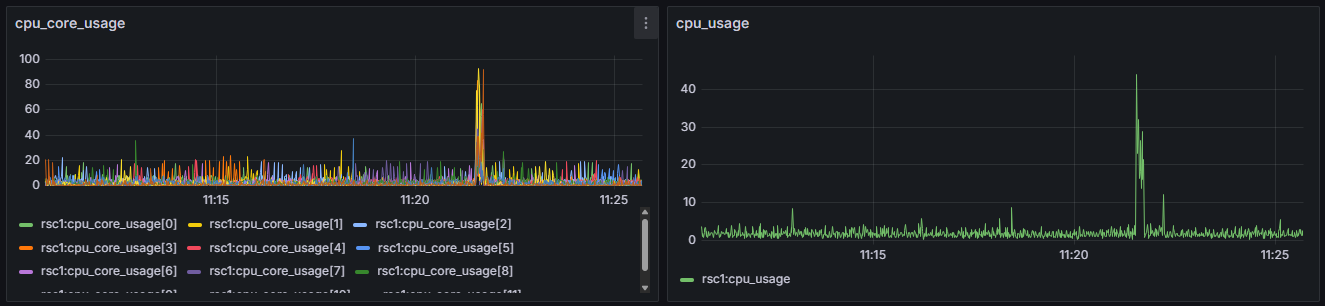
You can confirm the graph you configured.
5.3.7 Grafana and DB Query Service#
Grafana retrieves the data required to display graphs by using the DB query service provided by SpeeDBee Synapse. DB query service is one of the components and enables external access to data. For details, see “DB Query Service.”
5.3.7.1 Starting DB Query Service#
-
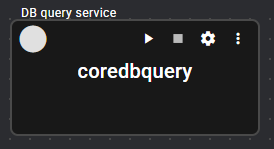
Press the panel tab of “System” to open the System panel.
-
Press the settings icon of DB Query Service.
-
Turn on "Token authentication," select all tokens and press "Save."
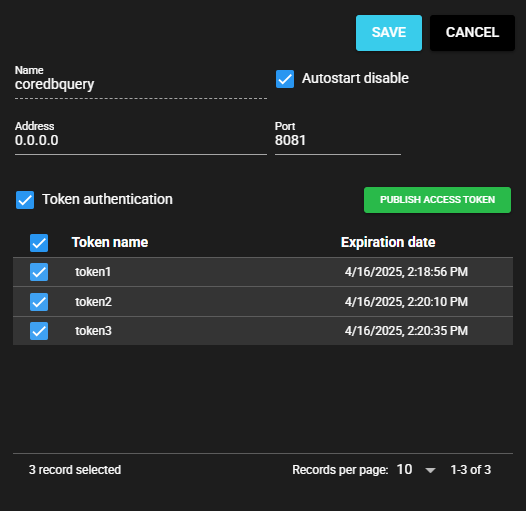
-
Press the Start Core DB Query icon. If it is already running, press the Stop icon and then the Start icon.
5.3.8 Changing the data count limit for a graph#
If only a portion of the data is displayed, the number of data items may have exceeded the maximum. You can use the procedure below to change the maximum number of data items.
-
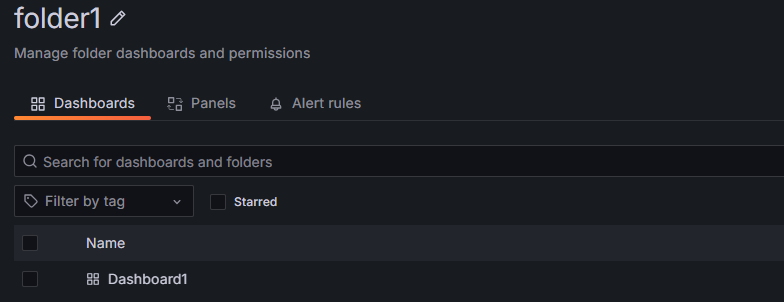
Execute the procedure shown in “Dashboard” to display a list of graphs.
-
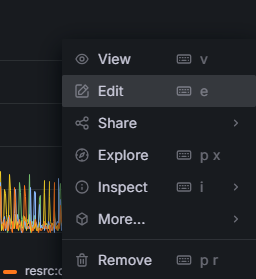
Press the menu icon at the top right of the graph.

-
A menu appears. Select “Edit.”
-
This displays the graph setting screen. The upper limit on the number of data items is set in the setting item "Query Limit (cnt)" on this screen. Changes to the values are reflected in the graph.
(The default value for “Query Limit (cnt)” is 10,000.)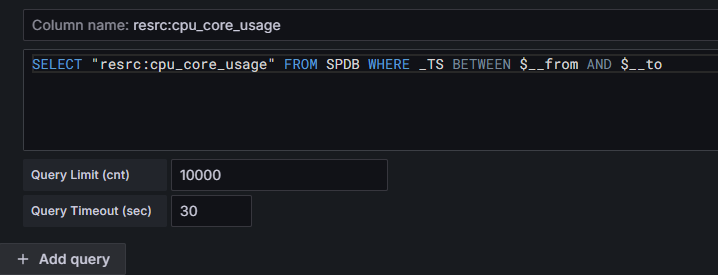
-
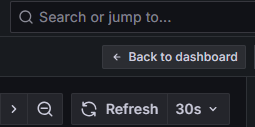
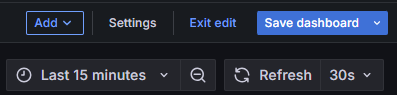
After changing the value, press the ESC key or the “Back to dashboard” icon in the upper right of the screen.
-
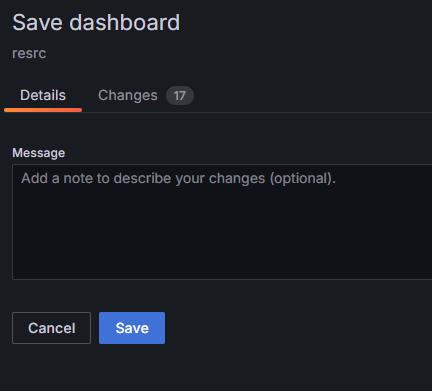
This returns the screen to the graph list screen. Press the “Save dashboard” icon at the top right of the screen.
-
Press “Save” to save the settings.
!!! “The timing when warning settings is reset” Please be aware that, after changing the settings, executing “Dashboard” procedure will reset the settings.
5.3.9 Manually Setting a Grafana Data Source#
Learn how to manually interact with Grafana to view the data.
There is no need to configure this setting if it has already been configured in the “Destination”.
-
Issue an access token as described in “Publish access token”.
Note: Keep the issued access token because it will be used later. -
Restart the DB Query Service by following the procedure shown in “Start the DB Query Service”.
-
Press the Grafana icon in the header to open the Grafana screen.
-
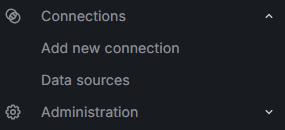
Hover over the “Connections” icon in the left menu and select “Data sources” from the menu that appears.
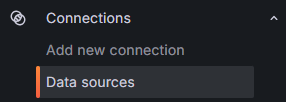
-
Select “SpeeDBee Synapse.”

-
Enter the following items.
Item Description URL Enter "http://{IP address of the environment where SpeeDBee Synapse is running}: {port where the DB query service is running}/dbquery."
Note: You can check or change the port on which the DB query service by accessing the “Port” setting item of the DB query service component. For details, see “DB Query Service”.API Key Enter the access token you issued in the previous step. 
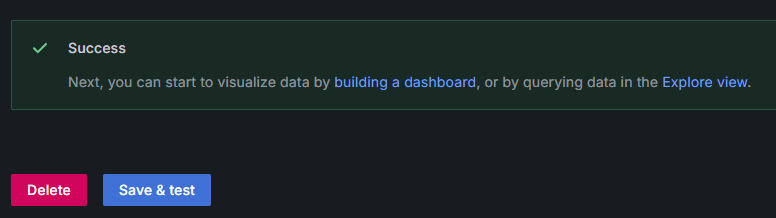
-
When you press “Save & test” and the message "Success" appears, the data source configuration is complete.