4.14 Various Logs
This section explains various logs of SpeeDBee Synapse.
4.14.1 Log Types#
SpeeDBee Synapse handles the following log types.
| Type | Description | Viewing on the screen | Download |
|---|---|---|---|
| SpeeDBee Synapse operation log | A history of SpeeDBee Synapse operations performed by users, etc. is recorded. For more information, see Operation Log. |
○ | ○ |
| WEBUI system log | The system information of WEBUI is recorded. | × | ○ |
| Core, component, and database system log | The system information of the core, components, and database is recorded. | × | ○ |
| Individual component system log | The system information of components is recorded. | ○ | ○ |
4.14.2 Operation Log#
All operations performed by users on SpeeDBee Synapse are recorded in the operation log. The operation log also records operations performed by SpeeDBee Synapse and external APIs.
4.14.2.1 View#
You can view the operation log by following the steps below.
-
Press the Log icon in the header.

-
The operation log is displayed.
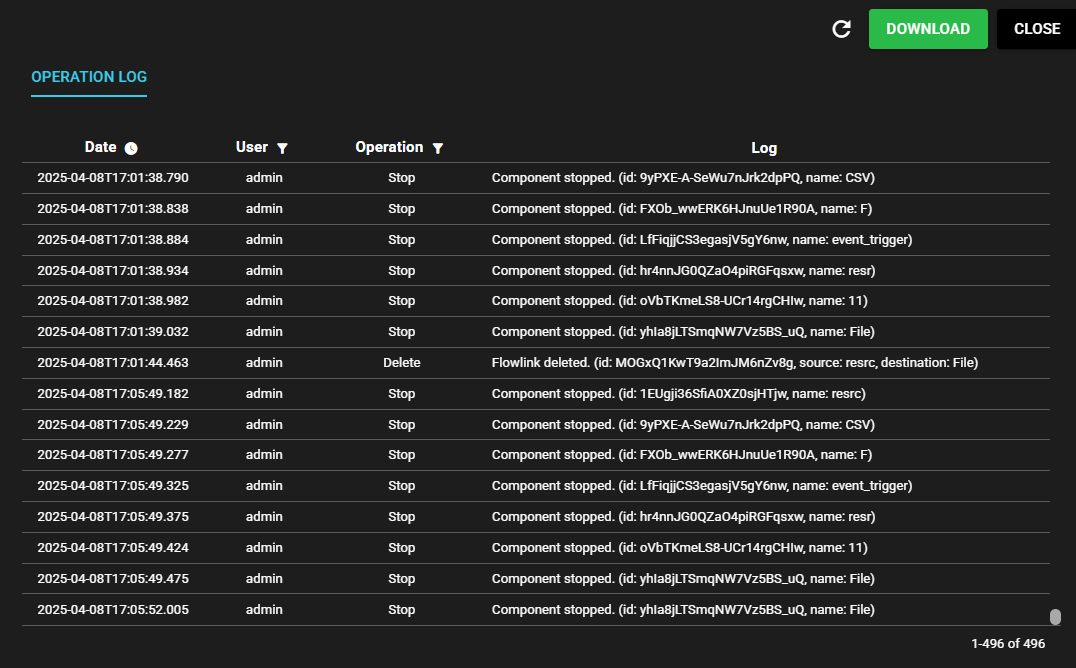
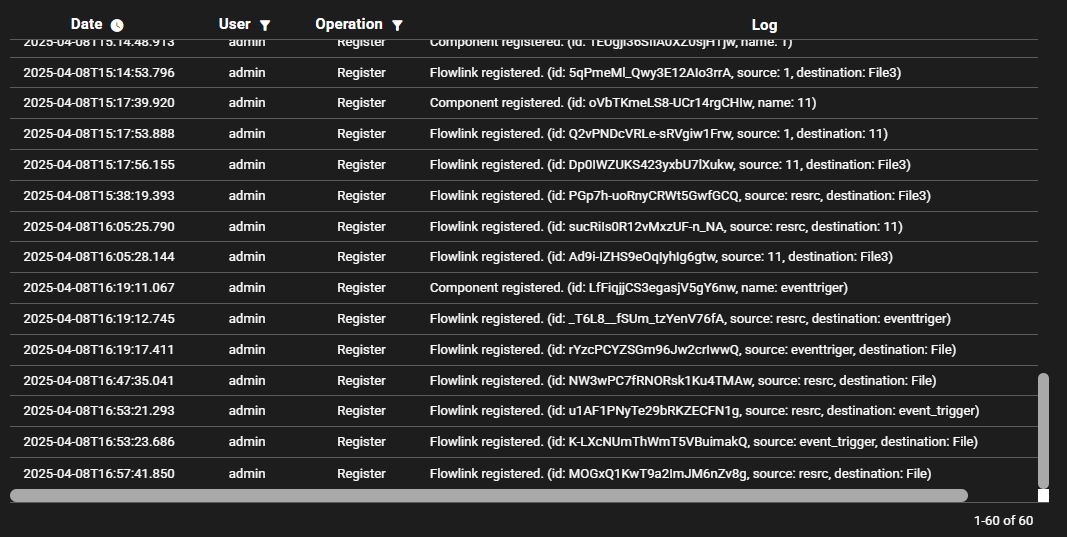
The operation log displays the following information.
Item Description Time Time when the operation was performed User User who performed the operation
Note 1: "System" refers to an operation performed by SpeeDBee Synapse
Note 2: "External API" refers to an operation performed by an external API.Operation Operation type Log Details of the operation
4.14.2.2 Refresh#
You can get the latest log by pressing the refresh button.

4.14.2.3 Narrowing Down#
You can narrow down the operation log to be viewed by time, user, and operation type.
Time
You can view the operation log only for the specified time range by following the steps below.
-
Press the icon next to Time.

-
Enter a time range and press Definition.

-
The log for the time range you entered is displayed.

User
You can view the operation log only for the specified user by following the steps below.
-
Press the icon next to User.

-
Select a user and press Definition.
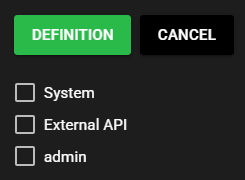
-
A log of operations performed by the selected user is displayed.

Operation
You can view the operation log only for the specified type of operation by following the steps below.
-
Press the icon next to Operation.

-
Select an operation log type and press Definition.
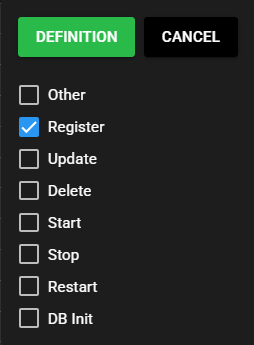
-
The selected type of operation log is displayed.
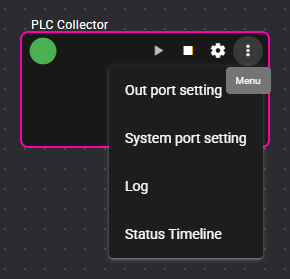
4.14.3 Component Individual Log#
A log output by a component is recorded.
You can also set the level of log output for each component from the log viewing screen of this function.
For more information on the setting method, see Individual Log Level Setting.
4.14.3.1 View#
You can view the component individual log by following the steps below.
-
Left-click the menu icon and select [Log].
-
The component individual log is displayed.
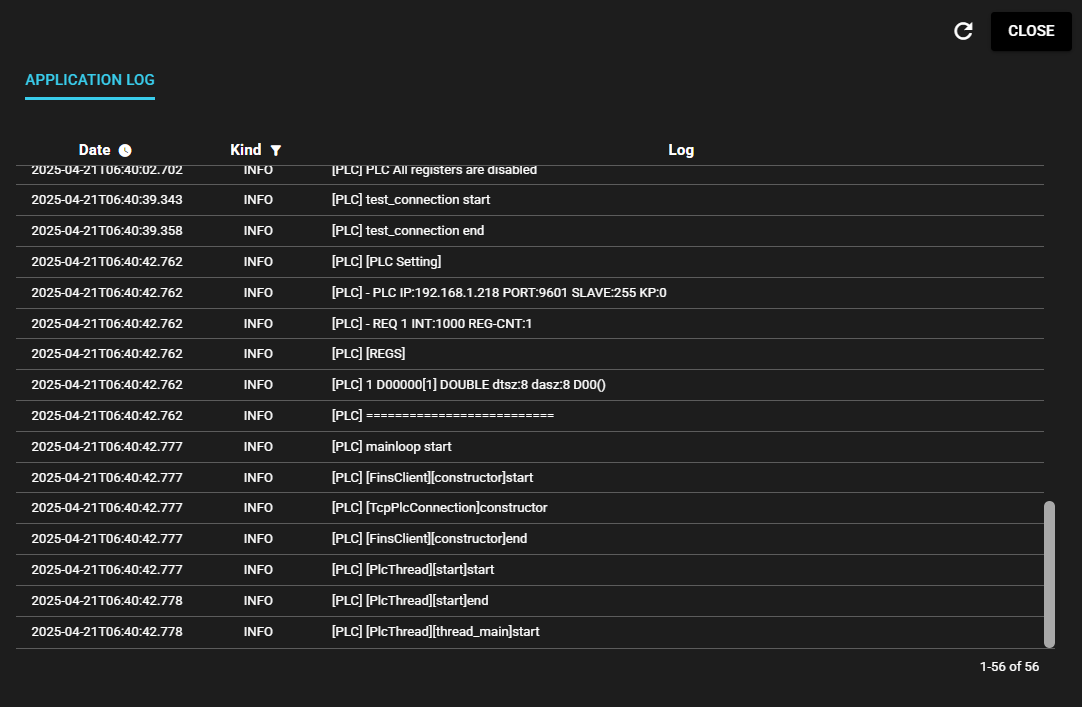
The component individual log displays the following information.
Item Description Time Time when the component output the log entry Kind Level of log output Log Log details
4.14.3.2 Refresh#
You can get the latest log by pressing the refresh button.
4.14.3.3 Narrowing Down#
You can narrow down the component individual log to be viewed by time and kind.
Time
You can view the component individual log only for the specified time range by following the steps below.
-
Press the icon next to Time.
-
Enter a time range and press Definition.
-
The log for the time range you entered is displayed.
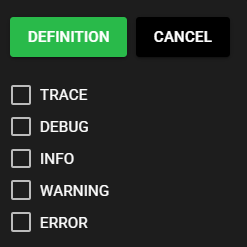
Kind
You can view the component individual log only for the specified kind (log level) by following the steps below.
-
Press the icon next to Kind.

-
Select a kind (log level) and press Definition.
-
The component individual log for the selected kind (log level) is displayed.
4.14.3.4 Load More#
You can view older log entries of the component individual log currently displayed by following the steps below.
-
When you scroll the component individual log to the top, Load more is displayed. Press this.
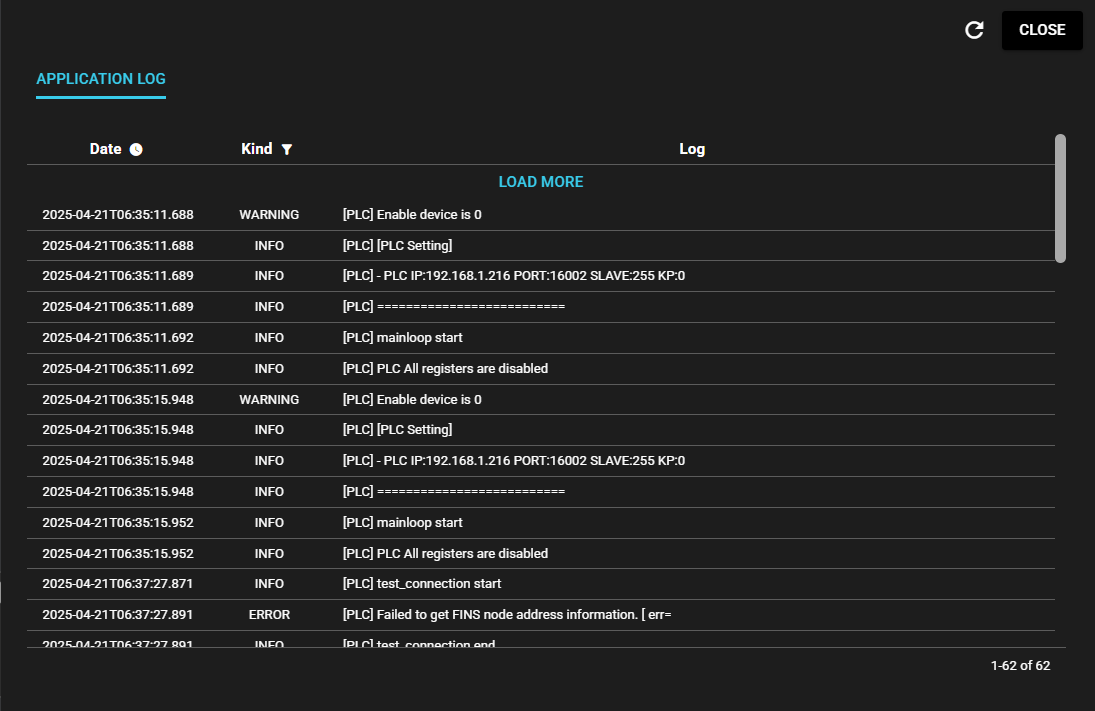
Note: If the oldest log entry is already displayed, Load more is not displayed.
4.14.3.5 Individual Log Level Setting#
You can set the level of log output for each component.
When this setting is enabled, the log level set in Log Setting in General Settings has no effect, and log information below the log level set individually is not output.
When this setting is disabled, the log is output according to the log level set in Log Setting in General Settings.
You can set the log level for the individual component currently displayed by following the steps below.
-
Press the Configuration icon.

-
The individual log level setting is displayed.
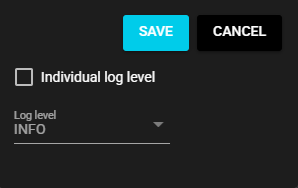
The individual log level setting displays the following information.
Item Description Save Saves the settings Cancel Discards the settings Individual log level Enables/disables individual log level Log level Level of log output -
Enable Individual log level.

-
Select a Log level.
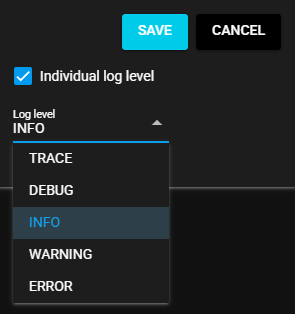
-
Press Save.
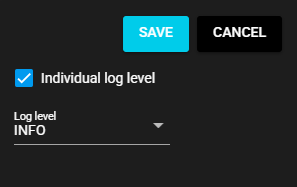
Press Cancel if you don't want to change the settings.
This operation is only available in Edit Mode.
4.14.4 Download#
You can download the various logs of SpeeDBee Synapse by following the steps below. Component Individual logs are included in the download target, but operation logs of all components and SpeeDBee Synapse are also included in the file.
-
Press the Download button.
-
A ZIP file is downloaded. The ZIP file stores log files in the following structure.
ZIP File Configuration├─webui │ ├─operation_log.YYYYMM.csv (SpeeDBee Synapse operation log) │ └─speedbeesynapse-webui-backend.log (WEBUI system log) ├─ speedbeesynapse.log (Core, component, and database system log) └─ speedbeesynapse-YYYYMMDDHHMMSS.log (Old version of speedbeesynapse.log)