4.2 Flow Editor
This section describes the Flow Editor. Flow Editor is the operation screen of SpeeDBee Synapse.
4.2.1 About the mode#
The Flow Editor has three types of modes:
| Mode | Description |
|---|---|
| Edit Mode | This is used to configure settings such as the data collection flow. Only users with the role of the system administrators or managers can use this function. |
| Run Mode | This operates the data collection flow. This function is available to users of all user roles. |
| List Mode | Settings for all components can be configured on the list screen. Only users with the role of the system administrators or managers can use this function. |
4.2.2 Items on the screen#
This section describes the items shown on the screen of Flow Editor.
4.2.2.1 Edit Mode#
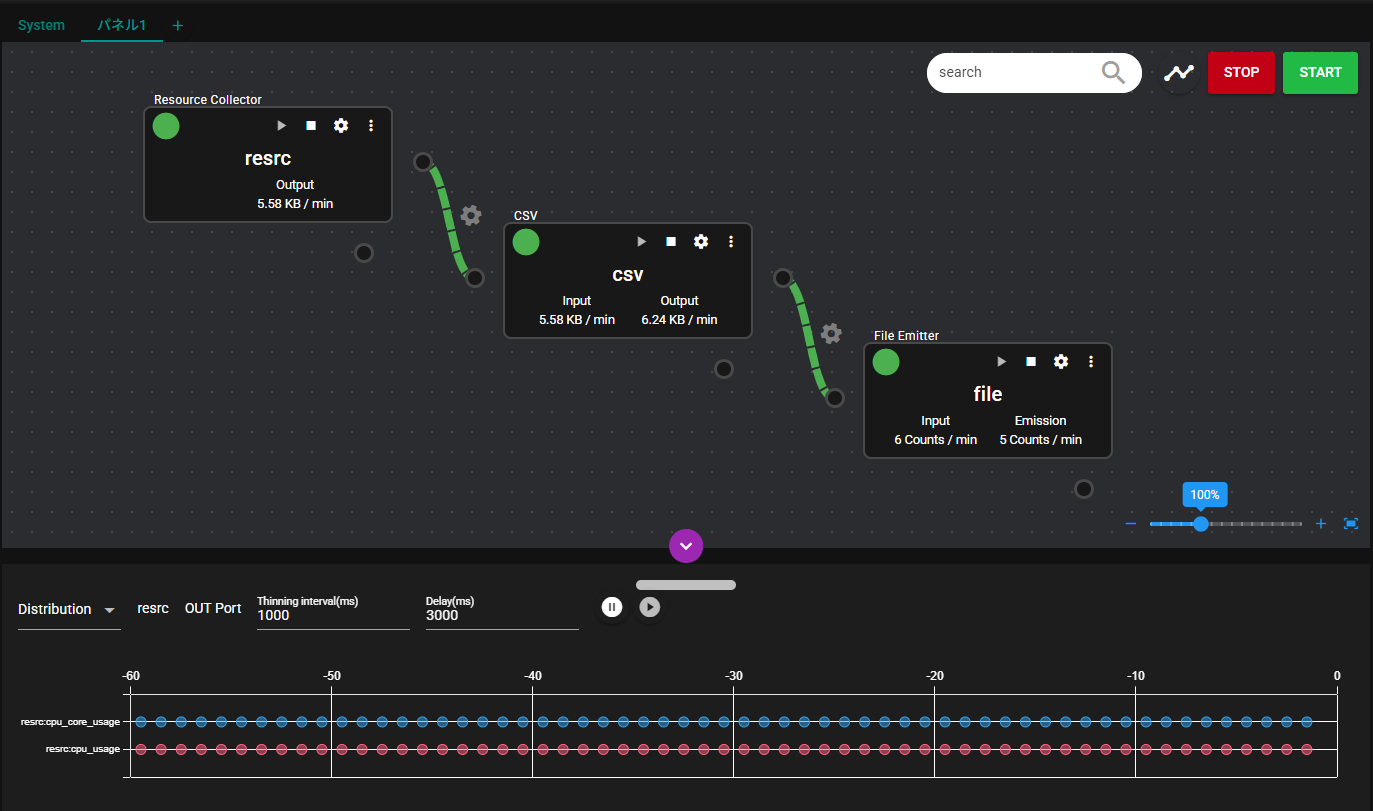
The items shown on the screen of Edit Mode Flow Editor are as follows.
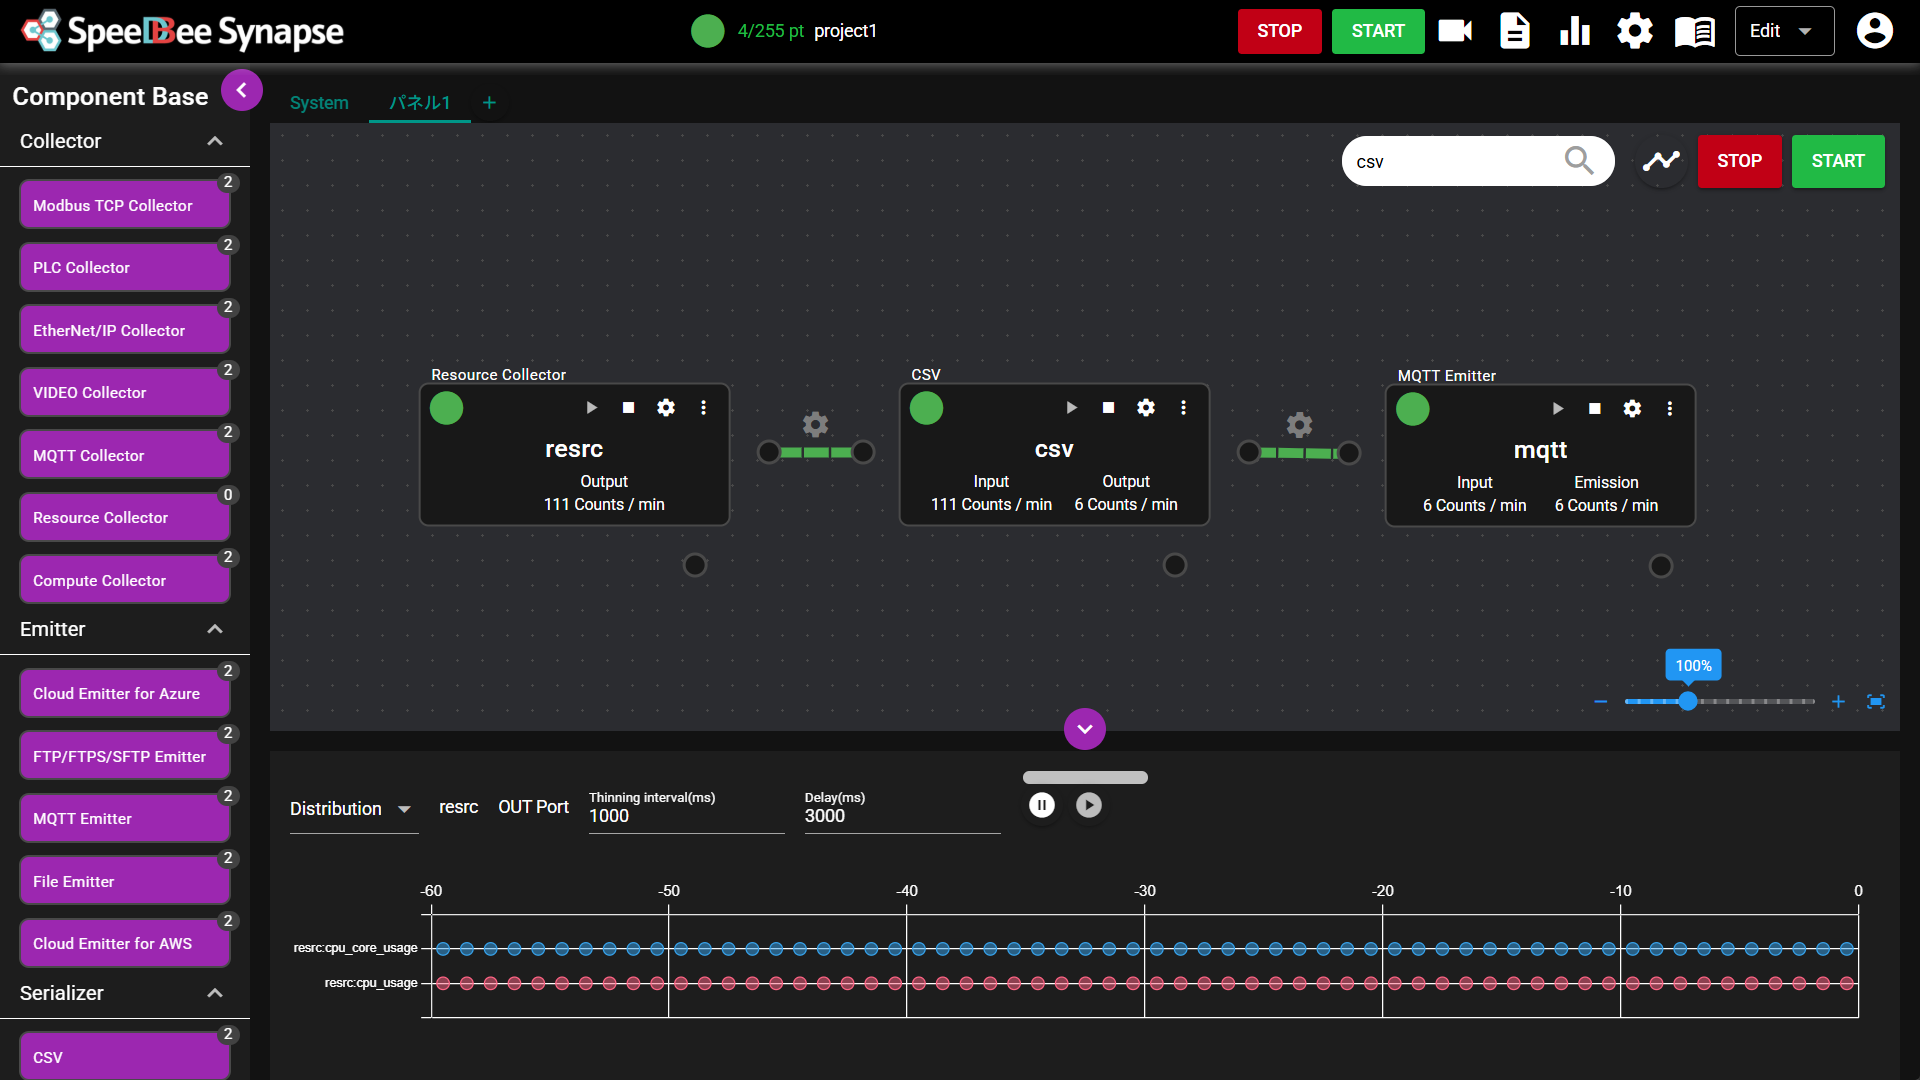
The Edit Mode screen consists of the following: ① Header, ② Componentbase, ③ Panel, and ④ Data monitor

| Number | Item | Description |
|---|---|---|
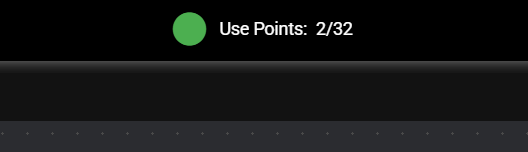
| ① | Use Points | This displays the number of registered license points and the number of points used. |
| ② | Current project | This displays the currently selected project. Note: For detail, see Management of Configuration Information (Project). |
| ③ | Stop button | Clicking the stop button stops all components registered in SpeeDBee Synapse. |
| ④ | Start button | Clicking the Start button starts all the components registered in SpeeDBee Synapse for which "Autostart disable" is set to OFF. |
| ⑤ | Video Viewer icon | Clicking the Video Viewer icon switches the display to the Viewer screen. Note: This is displayed only when the "i-Trigger" extension custom package is applied. For detail, see i-Trigger (extension custom package). |
| ⑥ | Log icon | Clicking the Log icon displays the SpeeDBee Synapse operation log window. Note: For detail, see Logs. |
| ⑦ | Graph icon | Clicking the Graph icon displays the Grafana screen. Note: For detail, see Integration with Grafana. |
| ⑧ | Setting menu icon | Clicking this icon displays the Setting Menu. Note: For detail, see Setting Menu. |
| ⑨ | Manual | Clicking this displays the manual screen. |
| ⑩ | Mode selection | Flow Editor display mode can be selected from below. ・ Edit Mode ・ Run Mode ・ List Mode Note: This is displayed only when a user logs in with the user role of system Administrator or manager. |
| ⑪ | User management icon | Clicking this displays the User Management menu. Note: For detail, see User Management. |
| Number | Item | Description |
|---|---|---|
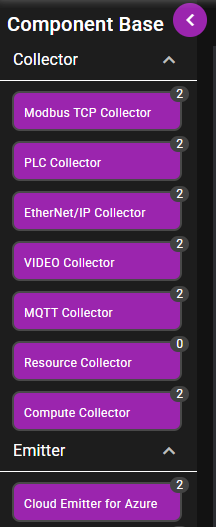
| ① | Open/close icon | By clicking this icon, the display/non-display of the componentbase is switched. |
| ② | Indicator | By clicking the indicator, the display/non-display of the component base can be switched. |
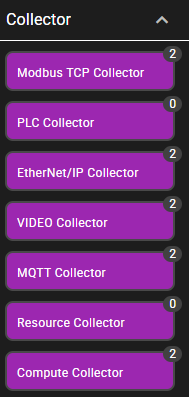
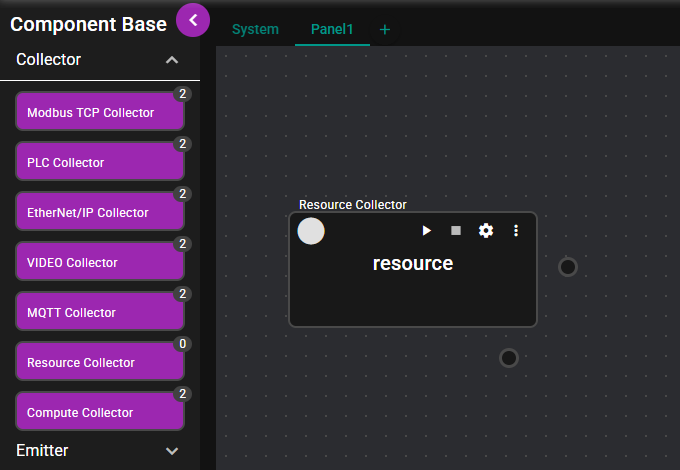
| ③ | Componentbase | This is a component that can be registered to the panel. The base name is displayed in the middle. The number of points used upon registration is displayed in the upper right. When the mouse pointer is placed over a component, the information of the component and the presence or absence of IN/OUT ports are additionally displayed. |
| ④ | Show All | By switching this ON, all hidden component bases are temporarily displayed. |
- The componentbase is available in the following types:
| Type | Link |
|---|---|
| Collector | For detail, see Collector. |
| Serializer | For detail, see Serializer. |
| Deserializer | For detail, see Deserializer. |
| Emitter | For detail, see Emitter. |
| Logic | For detail, see Logic (event) and Logic (Real time analysis/data manipulation). |
| Action | For detail, see Action. |
| Custom | For detail, see "Overview" of "Creation and Use of Custom Components". Note: This is displayed only when Custom Component has been added. |
-
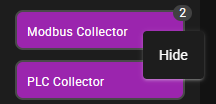
You can hide component bases as follows.
-
Right-click a component base.
-
Select "Hide".
How to show a hidden component base
- Turn on "Show All" to display hidden component bases.
- Right-click the displayed component base.
- Select "Show".
Scope of hide settings
Hide settings for component bases are saved per project.
When you switch projects, the new project's settings apply, so components hidden in the previous project may become visible. -

| Number | Item | Description |
|---|---|---|
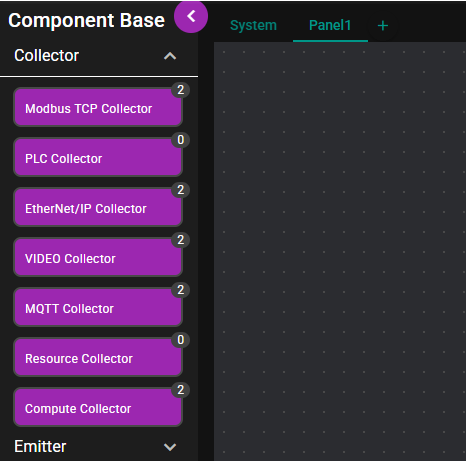
| ① | Tab | This tab is used to switch the panel to display. |
| ② | Add panel icon | By clicking this icon, a new panel can be added. |
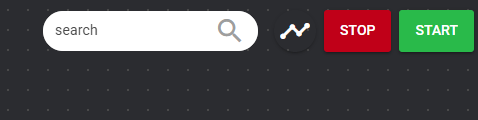
| ③ | Component search box | The location of a component can be searched using this box. |
| ④ | Status Timeline | Clicking this displays a screen where the component status is organized in chronological order. Note: For detail, see Status Timeline. |
| ⑤ | Stop button | Clicking this stops all components on the panel. |
| ⑥ | Start button | Clicking this starts all components on the panel for which Autostart Disabled is OFF. |
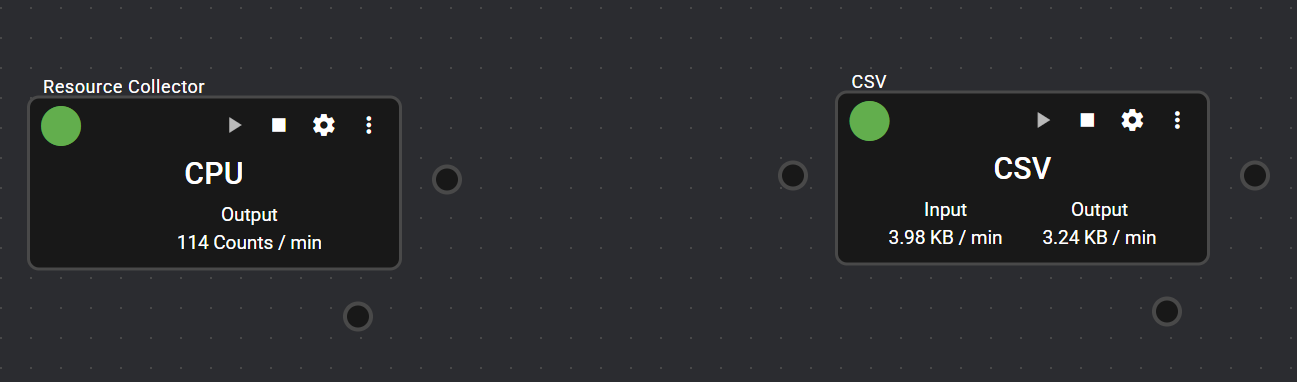
| ⑦ | Component | This is the component registered to the panel. |
| ⑧ | Flowlink | This is a flowlink registered to the panel. Note: A flowlink is an object that connects two components and transfers data between them. For detail, see Add a Flowlink. |
| ⑨ | Display magnification | The panel display magnification can be adjusted. |
- For detail, see Panel.
- The panel named "System" is exclusively used for system component.

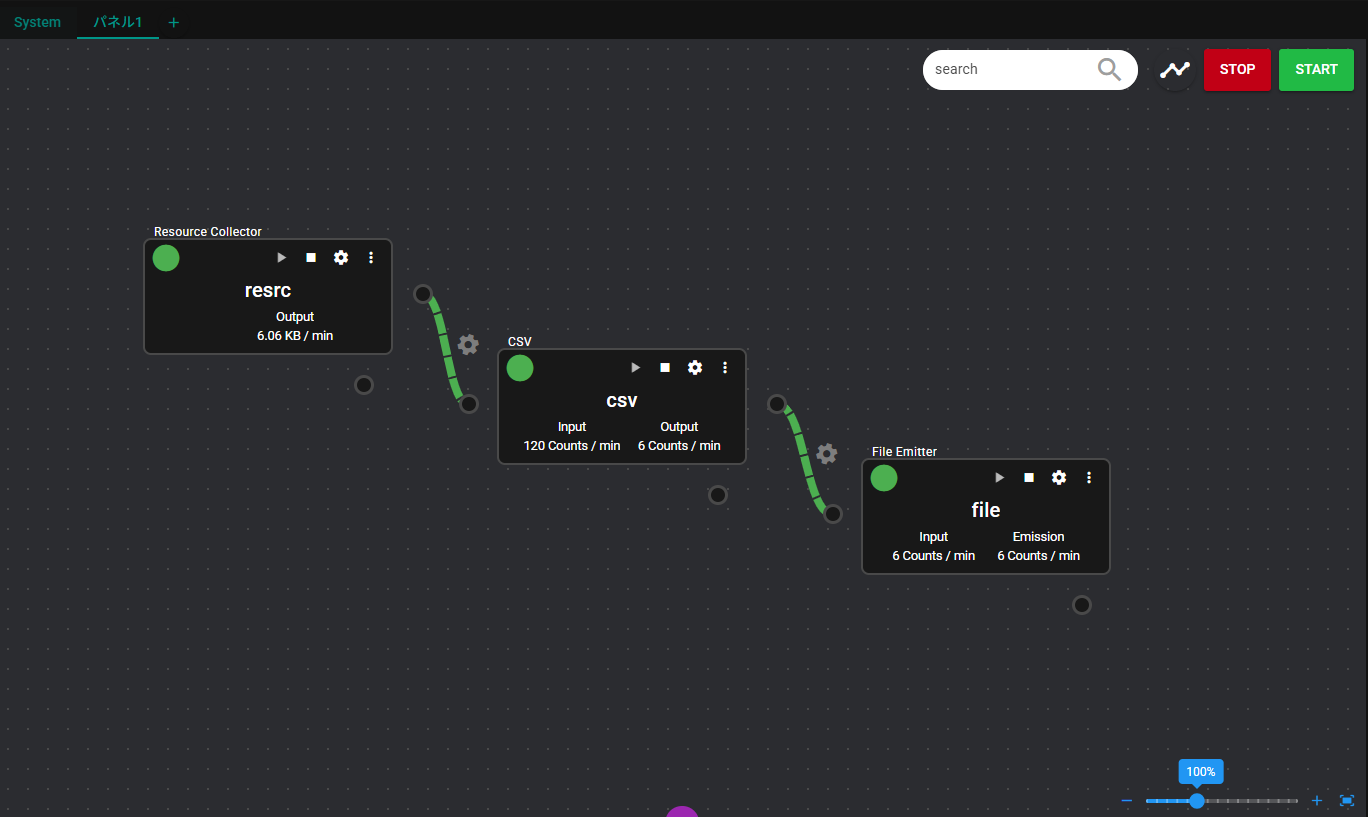
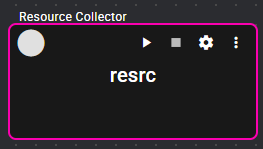
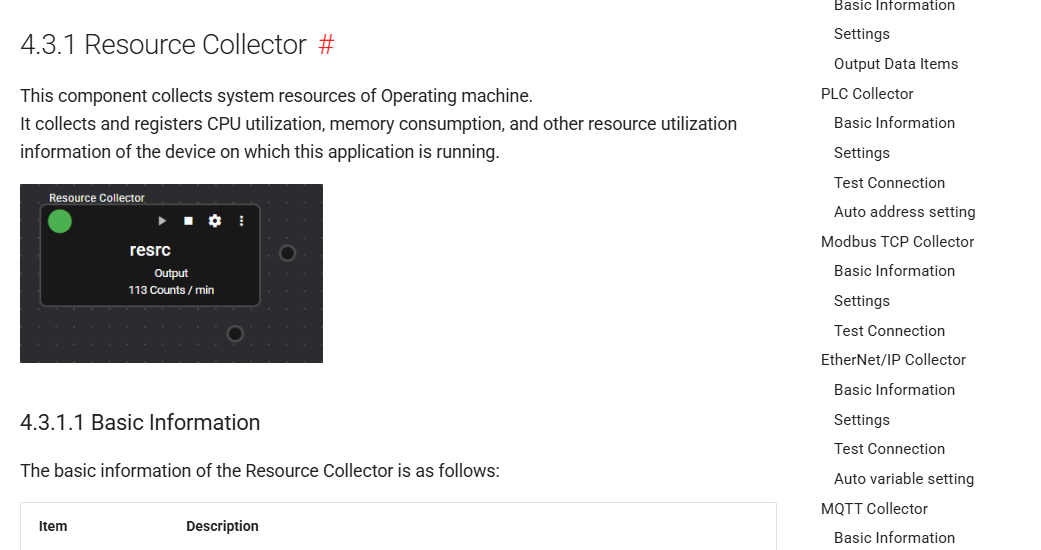
| Number | Item | Description |
|---|---|---|
| ① | IN Port | This port accepts data input. Note 1: Clicking this displays the data flowing to the port on the data monitor. For detail, see Data Monitor. Note 2: Right-clicking this allows users to configure settings. For detail, see IN Port. |
| ② | Componentbase name | Componentbase name is displayed. |
| ③ | Status lamp | Colors corresponding to the component operation status are displayed. For detail, see Status List. |
| ④ | Start icon | Clicking this icon starts the component. |
| ⑤ | Stop icon | Clicking this icon stops the component. |
| ⑥ | Configuration icon | Clicking this icon displays the detail of component configuration. |
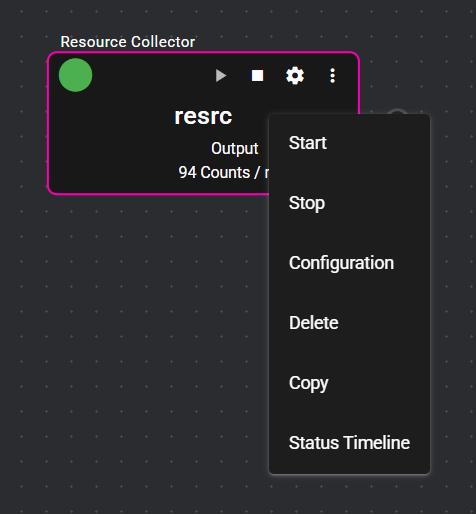
| ⑦ | Menu icon | Clicking this icon displays a menu that provides various options, such as port settings, logs, and the status timeline for the component. |
| ⑧ | Component name | Component name is displayed. |
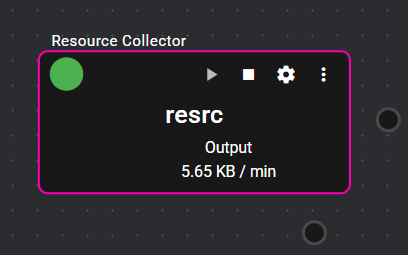
| ⑨ | Data volume monitor | This displays the volume of data a component is processing. |
| ⑩ | OUT Port | This port outputs data. Note 1: Clicking this displays the data flowing to the port on the data monitor. For detail, see Data Monitor. Note 2: Right-clicking this allows users to configure settings. For detail, see OUT Port. |
| ⑪ | SYSTEM Port | This port outputs system-related data. Note 1: Clicking this displays the data flowing to the port on the data monitor. For detail, see Data Monitor. Note 2: Right-clicking this allows users to configure settings. For detail, see SYSTEM Port. |
- For detail, see Component.
| Number | Item | Description |
|---|---|---|
| ① | Open/close icon | By clicking the indicator, the display/non-display of the data monitor can be switched. |
| ② | Display size adjustment grip | By dragging the cursor and moving the mouse up and down, the display size of the data monitor can be adjusted. |
| ③ | Display type selection form | The data monitor display method can be selected. |
| ④ | Selection port | A selected port is displayed. |
| ⑤ | Thinning interval | The thinning interval for the data to be displayed can be configured. |
| ⑥ | Delay time | The delay time for the data to be displayed can be configured. |
| ⑦ | Monitor display area | The selected type of monitor is displayed. |
- For detail, see Data Monitor.
4.2.2.2 Run Mode#
The items shown on the Run Mode Flow Editor screen are as follows:
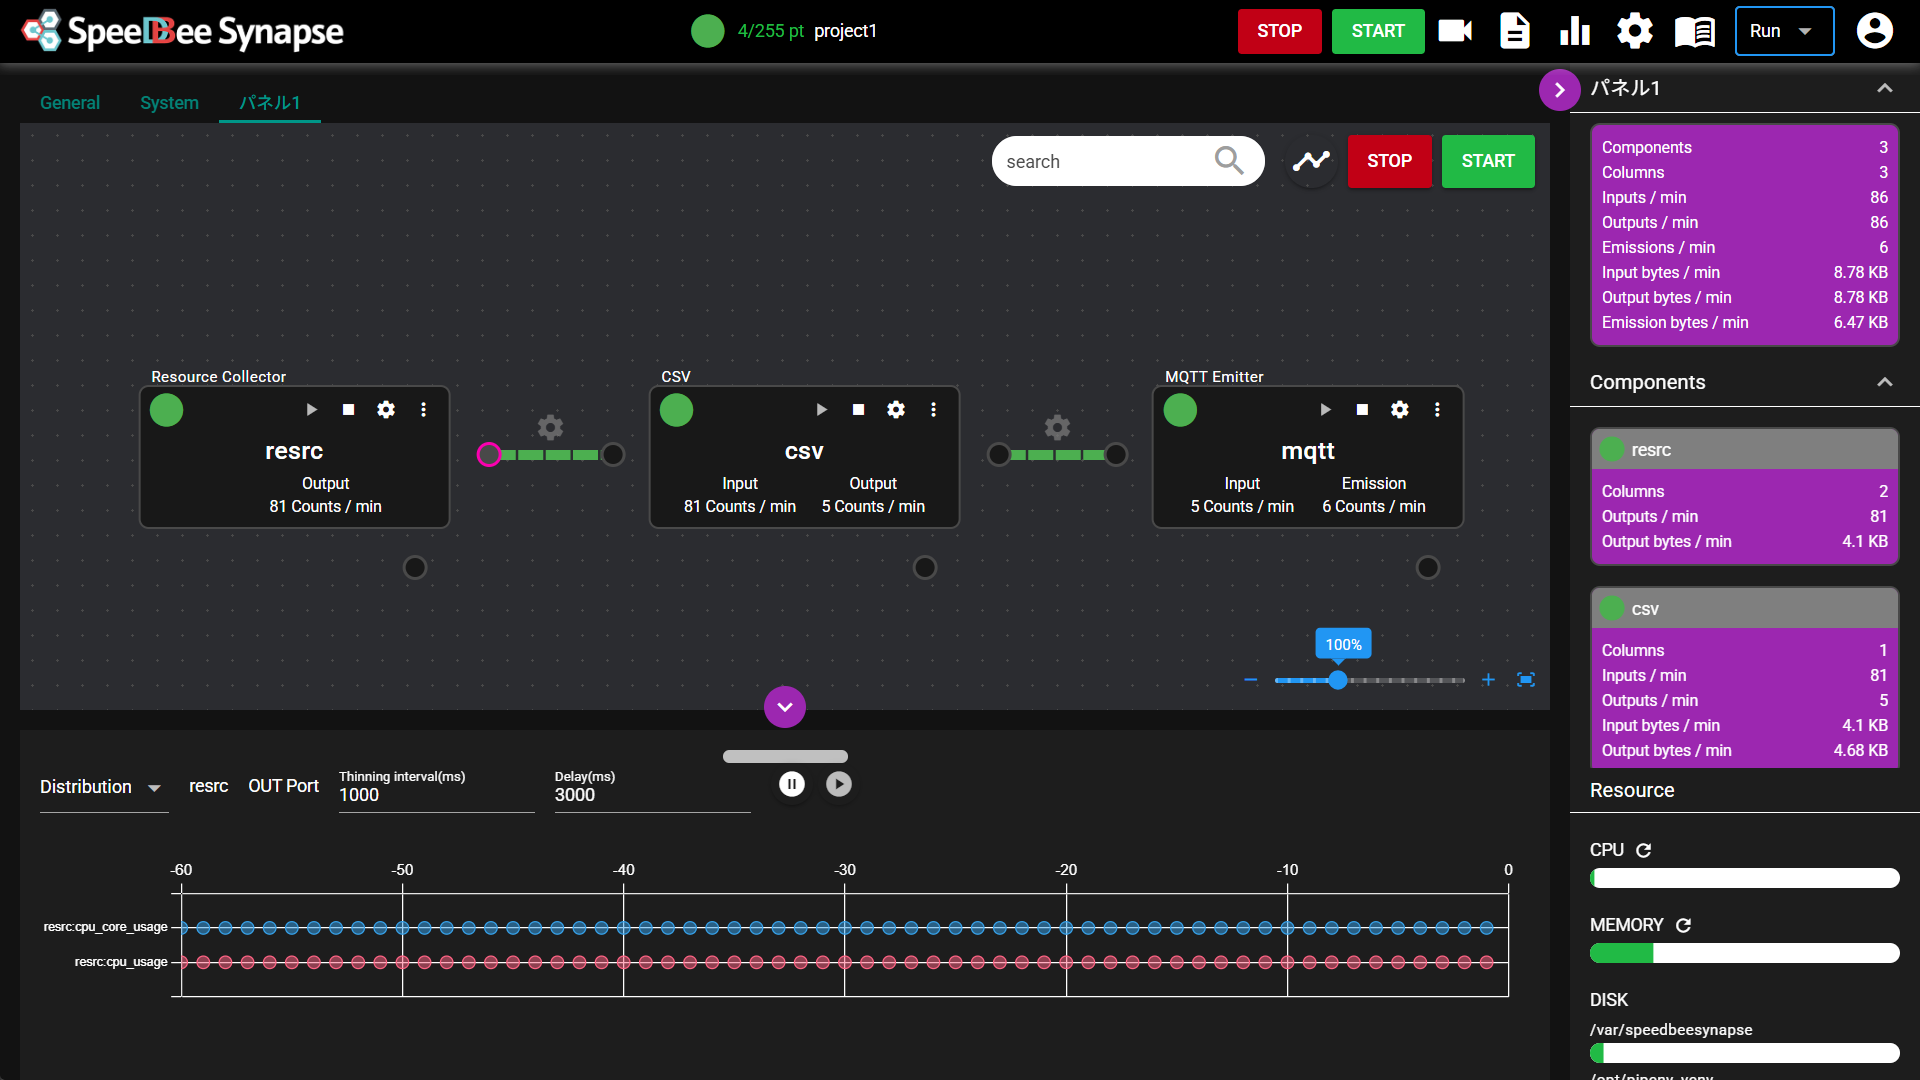
The Run Mode screen consists of ① Header, ② Panel, ③ Panel status, ④ Data monitor, and ⑤ System resources.

| Number | Item | Description |
|---|---|---|
| ① | Use Points | This displays the number of registered license points and the number of points used. |
| ② | Current project | This displays the currently selected project. Note: For detail, see Management of Configuration Information (Project). |
| ③ | Stop button | Clicking the stop button stops all components registered in SpeeDBee Synapse. |
| ④ | Start button | Clicking the Start button starts all the components registered in SpeeDBee Synapse for which "Autostart disable" is set to OFF. |
| ⑤ | Video Viewer icon | Clicking the Video Viewer icon switches the display to the Viewer screen. Note: This is displayed only when the "i-Trigger" extension custom package is applied. For detail, see i-Trigger (extension custom package). |
| ⑥ | Log icon | Clicking the Log icon displays the SpeeDBee Synapse operation log window. Note: For detail, see Logs. |
| ⑦ | Graph icon | Clicking the Graph icon displays the Grafana screen. Note: For detail, see Integration with Grafana. |
| ⑧ | Setting menu icon | Clicking this icon displays the Setting Menu. Note: The language configuration is the only menu available for selection. For detail, see Setting Menu. |
| ⑨ | Manual | Clicking this displays the manual screen. |
| ⑩ | Mode selection | Flow Editor display mode can be selected from below. ・ Edit Mode ・ Run Mode ・ List Mode Note: This is displayed only when a user logs in with the user role of system Administrator or manager. |
| ⑪ | User management icon | Clicking this displays the User Management menu. Note: For detail, see User Management. |
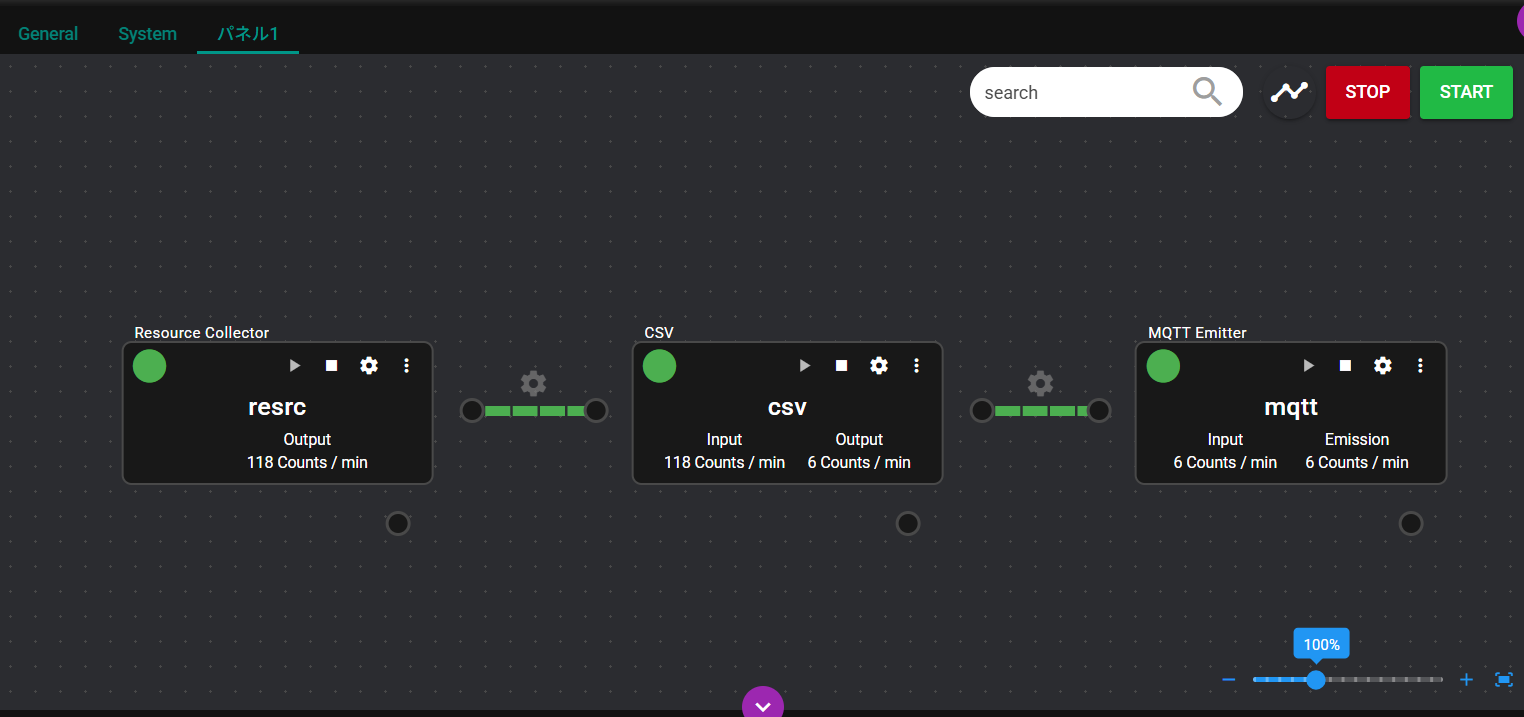
| Number | Item | Description |
|---|---|---|
| ① | Tab | This tab is used to switch the panel to display. |
| ② | Component search box | The location of a component can be searched using this box. |
| ③ | Status Timeline | Clicking this displays a screen where the component status is organized in chronological order. Note: For detail, see Status Timeline. |
| ④ | Stop button | Clicking this stops all components on the panel. |
| ⑤ | Start button | Clicking this starts all components on the panel for which Autostart Disabled is OFF. |
| ⑥ | Component | This is the component registered to the panel. Note: The component is the module group that performs functions such as data collection, processing, analysis, and emission. |
| ⑦ | Flowlink | This is a flowlink registered to the panel. |
| ⑧ | Display magnification | The panel display magnification can be adjusted. |
- For detail, see Panel.
- The panel named "System" is exclusively used for system component.
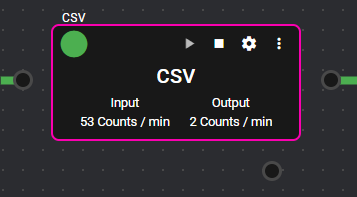
| Number | Item | Description |
|---|---|---|
| ① | IN Port | This port accepts data input. Note: Clicking this displays the data flowing to the port on the data monitor. For detail, see Data Monitor. |
| ② | Componentbase name | Componentbase name is displayed. |
| ③ | Status lamp | Colors corresponding to the component operation status are displayed. For detail, see Status List. |
| ④ | Start icon | Clicking this icon starts the component. |
| ⑤ | Stop icon | Clicking this icon stops the component. |
| ⑥ | Configuration icon | Clicking this icon displays the detail of component configuration. |
| ⑦ | Menu icon | Clicking this icon displays a menu that provides various options, such as port settings, logs, and the status timeline for the component. |
| ⑧ | Component name | Component name is displayed. |
| ⑨ | Data volume monitor | This displays the volume of data a component is processing. |
| ⑩ | OUT Port | This port outputs data. Note: Clicking this displays the data flowing to the port on the data monitor. For detail, see Data Monitor. |
| ⑪ | SYSTEM Port | This port outputs system-related data. Note: Clicking this displays the data flowing to the port on the data monitor. For detail, see Data Monitor. |
- For detail, see Component.
| Number | Item | Description |
|---|---|---|
| ① | Open/close icon | By clicking this icon, the display/non-display of the panel status can be switched. |
| ② | Indicator | By clicking the indicator, the display/non-display of the component base can be switched. |
| ③ | Panel status | This displays the status of the panel. |
| ④ | Component status | This displays the status of the component. |
- For detail, see Panel Status.
| Number | Item | Description |
|---|---|---|
| ① | Refresh icon | Clicking this icon updates the contents of the display. |
| ② | Gauge | This displays the ratios of resources. |
- For detail, see System Resources.
| Number | Item | Description |
|---|---|---|
| ① | Open/close icon | By clicking the indicator, the display/non-display of the data monitor can be switched. |
| ② | Display size adjustment grip | By dragging the cursor and moving the mouse up and down, the display size of the data monitor can be adjusted. |
| ③ | Display type selection form | The data monitor display method can be selected. |
| ④ | Selection port | A selected port is displayed. |
| ⑤ | Thinning interval | The thinning interval for the data to be displayed can be configured. |
| ⑥ | Delay time | The delay time for the data to be displayed can be configured. |
| ⑦ | Monitor display area | The selected type of monitor is displayed. |
- For detail, see Data Monitor.
4.2.2.3 List Mode#
The items shown on the screen of List Mode Flow Editor are as follows.
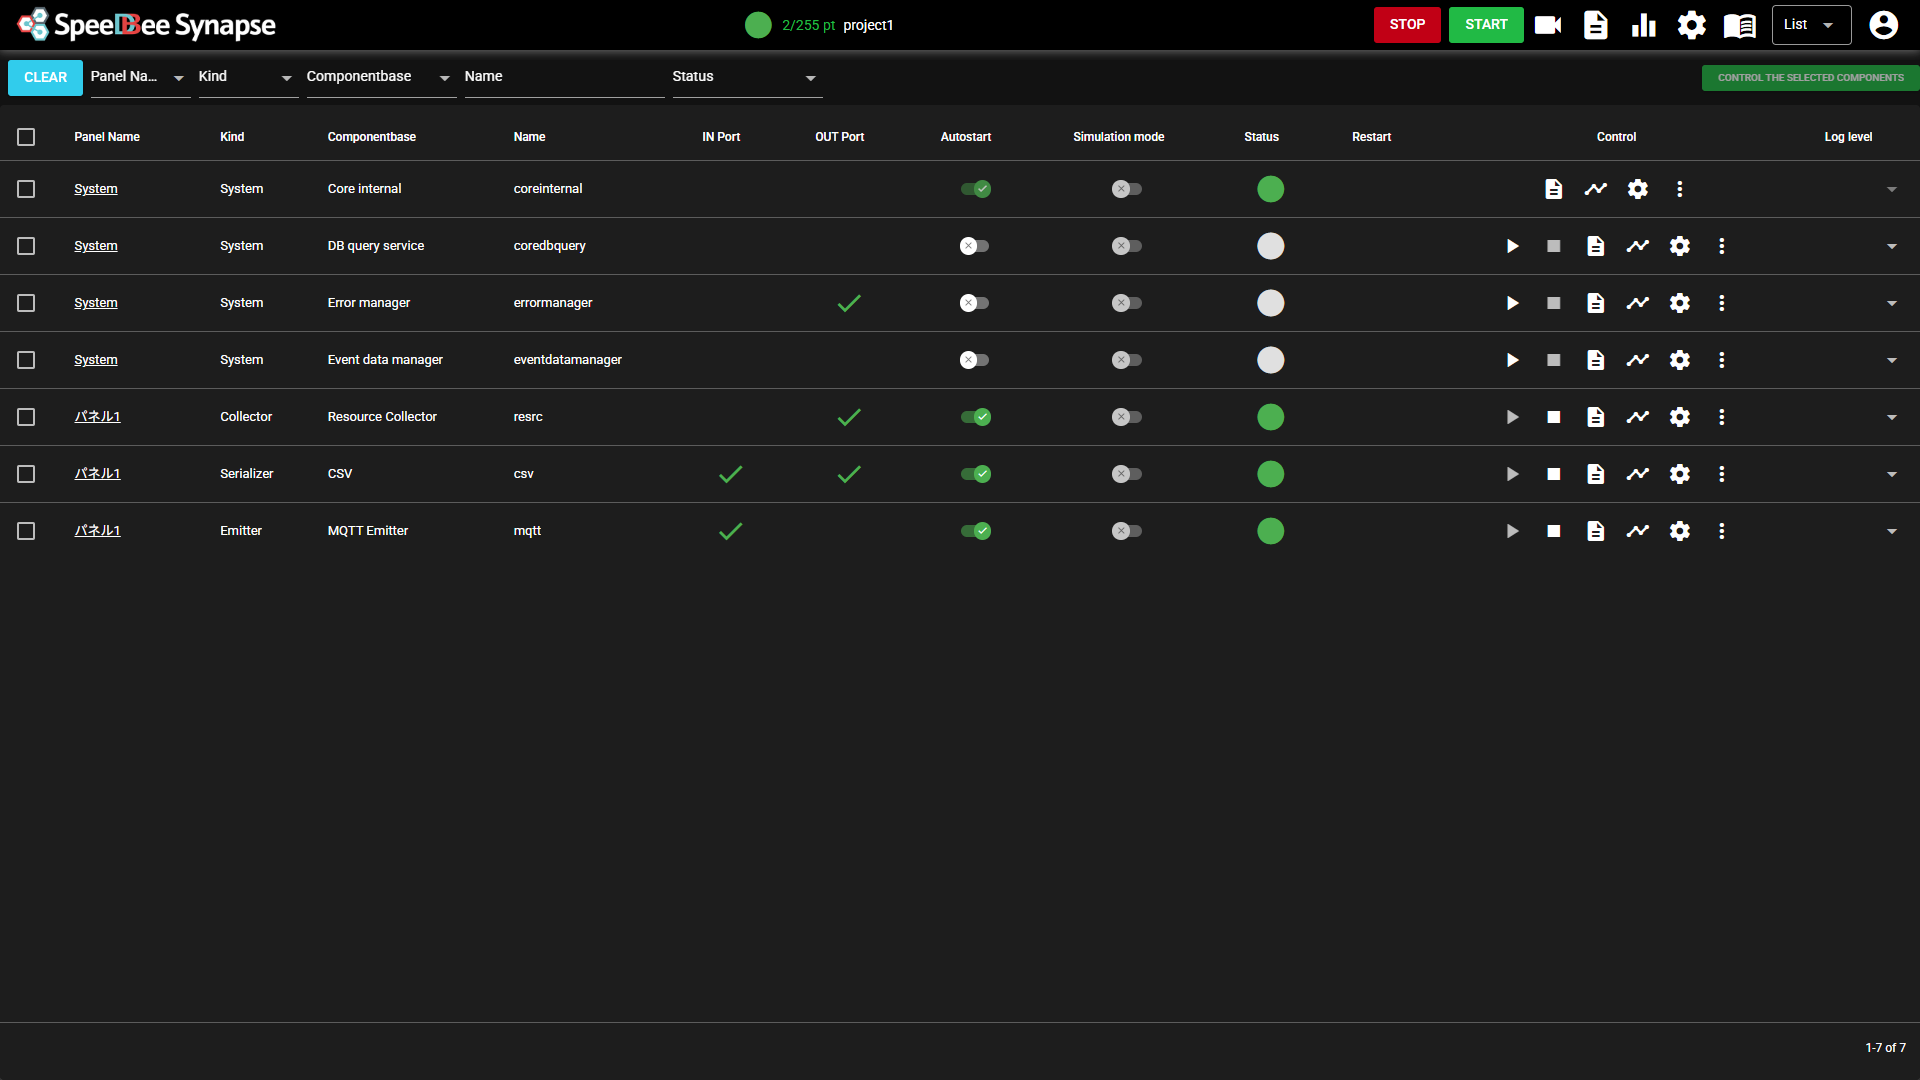
The List Mode screen consists of the following: ① Header, ② List header, and ③ Component list
① Header

| Number | Item | Description |
|---|---|---|
| ① | Use Points | This displays the number of registered license points and the number of points used. |
| ② | Current project | This displays the currently selected project. Note: For detail, see Management of Configuration Information (Project). |
| ③ | Stop button | Clicking the stop button stops all components registered in SpeeDBee Synapse. |
| ④ | Start button | Clicking the Start button starts all the components registered in SpeeDBee Synapse for which "Autostart disable" is set to OFF. |
| ⑤ | Video Viewer icon | Clicking the Video Viewer icon switches the display to the Viewer screen. Note: This is displayed only when the "i-Trigger" extension custom package is applied. For detail, see i-Trigger (extension custom package). |
| ⑥ | Log icon | Clicking the Log icon displays the SpeeDBee Synapse operation log window. Note: For detail, see Logs. |
| ⑦ | Graph icon | Clicking the Graph icon displays the Grafana screen. Note: For detail, see Integration with Grafana. |
| ⑧ | Setting menu icon | Clicking this icon displays the Setting Menu. Note: For detail, see Setting Menu. |
| ⑨ | Manual | Clicking this displays the manual screen. |
| ⑩ | Mode selection | Flow Editor display mode can be selected from below. ・ Edit Mode ・ Run Mode ・ List Mode Note: This is displayed only when a user logs in with the user role of system Administrator or manager. |
| ⑪ | User management icon | Clicking this displays the User Management menu. Note: For detail, see User Management. |
② List header

| Number | Item | Description |
|---|---|---|
| ① | Clear | Clicking this clears the filter conditions. |
| ② | Panel name | Only components in the selected panel are displayed in the component list. |
| ③ | Type | Only components of the selected type are displayed in the component list. |
| ④ | Component base | Only components of the selected component base are displayed in the component list. |
| ⑤ | Name | Only components whose names partially match the entered string are displayed in the component list. Note: Case is not distinguished. |
| ⑥ | Status | Only components with the selected status are displayed in the component list. Note: For details on status, see Status List. |
| ⑦ | Control the selected components | Clicking this opens a menu to control the components selected in the component list. Note: For detail, see Control the selected components. |
③ Component list
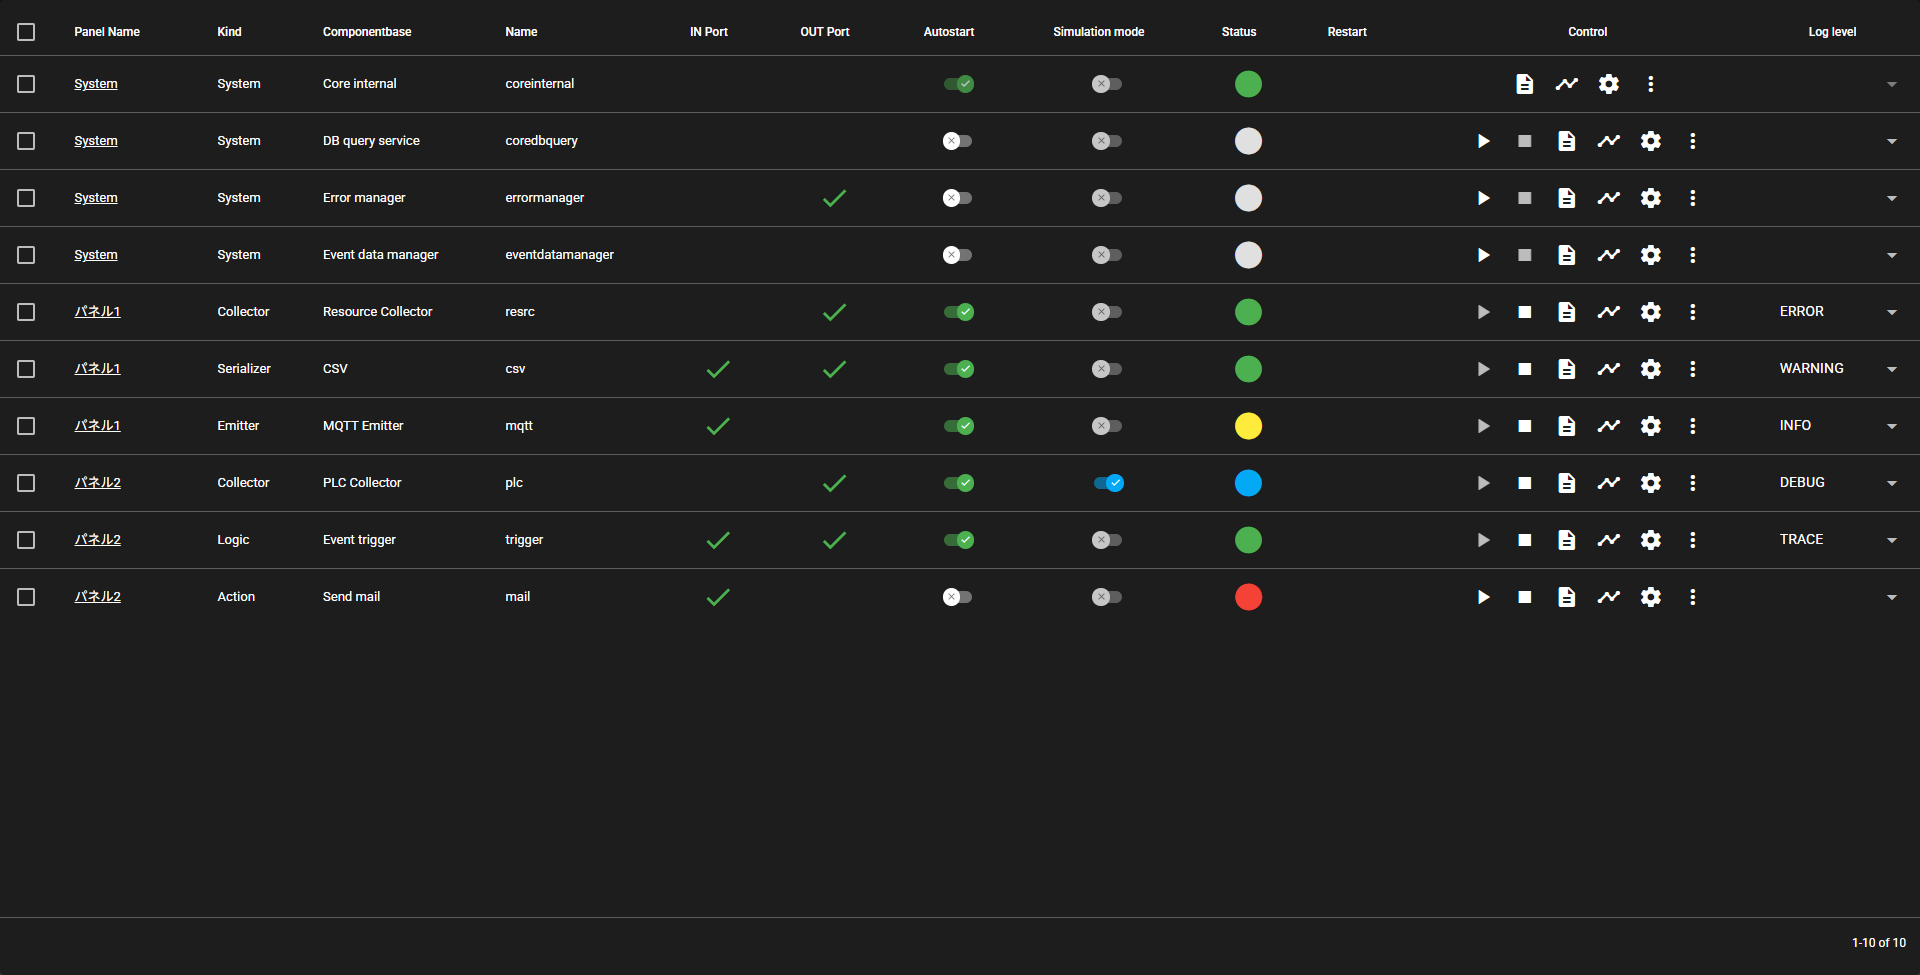
| Number | Item | Description |
|---|---|---|
| ① | Selection | Select this to control the selected component. |
| ② | Panel name | The name of the panel where the component is placed. Note: Clicking this displays the clicked panel in Edit Mode. |
| ③ | Kind | The kind of the component. |
| ④ | Componentbase | The name of the componentbase. |
| ⑤ | Name | The name of the component. |
| ⑥ | IN port | Displayed if the component has an IN port. |
| ⑦ | OUT port | Displayed if the component has an OUT port. |
| ⑧ | Autostart | Displays whether autostart of the component is enabled or disabled. Click to toggle enabled/disabled. |
| ⑨ | Simulation mode | Displays whether simulation mode of the component is enabled or disabled. Click to toggle enabled/disabled. |
| ⑩ | Status | Displays the status of the component. Note: For details on status, see Status List. |
| ⑪ | Restart | Displays whether the component needs to be restarted. |
| ⑫ | Control | Performs various controls of the component. Note: For details, see Component list control. |
| ⑬ | Log level | Displays the individual log level of the component. Change the log level by selecting from the dropdown. |
4.2.3 Screen Operation#
This section describes how to operate the Flow Editor.
4.2.3.1 Setting menu#
This section describes how to operate the Setting Menu.
The Setting Menu can be operated only with Edit Mode.
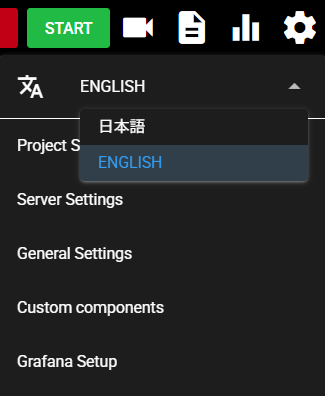
4.2.3.1.1 Language configuration#
Languages can be switched by following the steps below.
-
Press the Setting Menu icon.

-
Select the language selection pull-down menu.
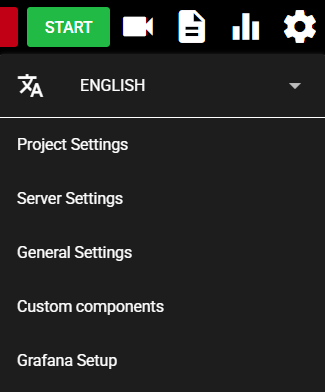
-
Select a language.
-
A selected language is reflected in SpeeDBee Synapse.
The currently available languages are as follows:
| Language | Code | Description |
|---|---|---|
| 日本語 | ja | Displays Synapse in Japanese. |
| ENGLISH | en | Displays Synapse in English. |
4.2.3.1.2 Project Settings#
This enables the configuration of a project. For detail, see Management of Configuration Information (Project).
4.2.3.1.3 Server Settings#
By following the steps below, server settings can be confirmed and updated, and the database can be reset.
-
Press the Setting Menu icon.
-
Select "Server Settings".
-
From the following items, input any one and press "Save" to update the configuration.

Item Description Server Server instance name This is a name assigned to SpeeDBee Synapse.
The name is displayed in the general panel of Run Mode. (If multiple SpeeDBee Synapse are used, they can be distinguished by assigning different names individually.)Description Descriptions including the purpose of SpeeDBee Synapse Database Storage path The database save location directory
Note: In some environments, this setting cannot be changed/edited.File type storage path File type database save location directory
Note: In some environments, this setting cannot be changed/edited.DB log path Directory for database log save location
Note: In some environments, this setting cannot be changed/edited.Storage keep size Maximum size to store data in storage If the data in the storage exceeds this keep size, the data is deleted starting from the oldest data. If the keep size is undefined, it is unlimited. Specify the storage keep time by group. If ON is selected, the keep time—the period for retaining data in the storage—can be configured for each group. Data that exceeds the keep time is deleted. However, even before the keep time expires, if the storage keep size is exceeded, data is deleted starting from the oldest data. Memory keep time (sec) This is the period during which data is stored in memory. Core API Port This is the port number used by the SpeeDBee Synapse to communicate between the web interface and the internal server.
Note: In some environments, this setting cannot be changed/edited.
Delete Data
-
Press "Delete data".
-
Select the data to delete and press "Delete".
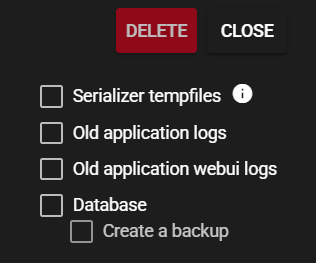
Item Description Serializer tempfiles These are temporary output files created by the serializer component.
Note: If deleted, the system is restarted.Application Log System logs for the core, component, and database Application log (UI) WEBUI system log Database Time series database of SpeeDBee Synapse
Note: If deleted, the system is restarted.Create a backup A backup is created before the database is deleted.
Note: This can be selected only when the database is checked. -
Press "Yes".
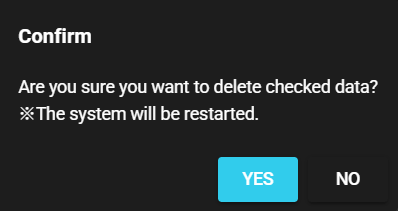
-
The selected data is deleted.
Start/Stop core
-
Press "Stop core" to stop the core function of SpeeDBee Synapse.
-
Press "Start core" to start the core function of SpeeDBee Synapse.
4.2.3.1.4 General Settings#
The general settings can be confirmed and updated by following the steps below.
-
Press the Setting Menu icon.
-
Select "General Settings".
-
Switch the tab, edit the items of choice, and then press "Save" to update the configuration.
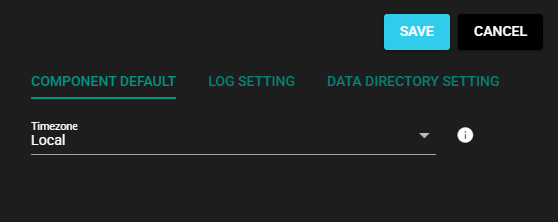
Item Description Component default This sets the common initial default value for the component. Log Setting This configures the application log. Data directory setting This configures the data directory.
4.2.3.1.5 Component default#
This confirms and edits initial values for common inputs of components.

| Item | Description |
| Timezone | The default time zone that can be configured for CSV, JSON serializers, and File Emitters |
4.2.3.1.6 Log configuration#
This confirms and edits the application log configuration.
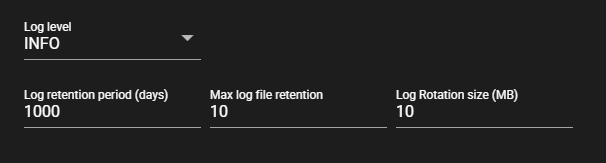
| Item | Description |
|---|---|
| Log level | Log output level |
| Log retention period (days) | Log retention period in days |
| Max log file retention | Maximum number of log files to be saved |
| Log Rotation size (MB) | Size of log rotation (MB) |
4.2.3.1.7 Data directory setting#
This confirms and edits the data directory configuration.
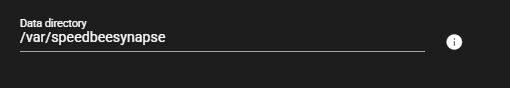
| Item | Description |
|---|---|
| Data directory | The base directory for save location and output location that can be configured with VIDEO Collector, File Emitter, and Event Recorder. Note: In some environments, this setting cannot be changed/edited. |
Note: If you change the data directory, the changes will be reflected in the following components from the next startup, and the new directory will be used.
- VIDEO Collector
- File Emitter
- Event Recorder
4.2.3.1.8 Custom (Python)#
The Python Custom Component can be configured. For detail, see Creation and Python Custom Component.
4.2.3.1.9 Custom (C)#
C Custom Component can be configured. For detail, see Creation of C language Custom Component.
4.2.3.1.10 Grafana Setup#
This enables the configuration of Grafana. For detail, see Integration with Grafana.
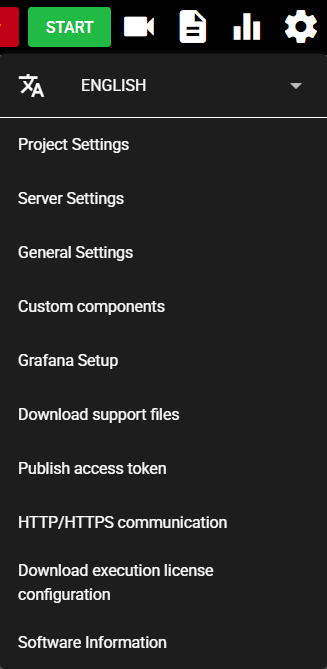
4.2.3.1.11 Download support files#
Files to be given to the SpeeDBee Synapse support staff can be downloaded by following the steps below.
-
Press the Setting Menu icon.
-
Select "Download support files".
-
Select the file to download.
Note: Select "Config, Log files only" only as a standard procedure. Confidential information does not have to be included unless instructed by support staff to do so.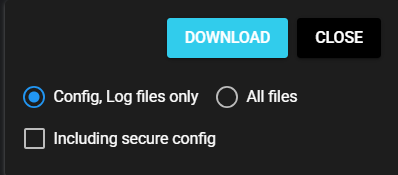
-
Press "Download".
-
Support files are downloaded.
Contact the support staff by following the instructions in Contact manufacturer.
Protected Custom Components
When you select "All files" for download, custom components are included.
However, protected custom components (Python, C, and SCC packages) are excluded from the support file download for security reasons.
4.2.3.1.12 Publish access token#
Access token can be published by following the steps below. The published access tokens can be used in "DB query service", "Integration with Grafana", and "Integration with control program".
-
Press the Setting Menu icon.
-
Select "Publish access token".
-
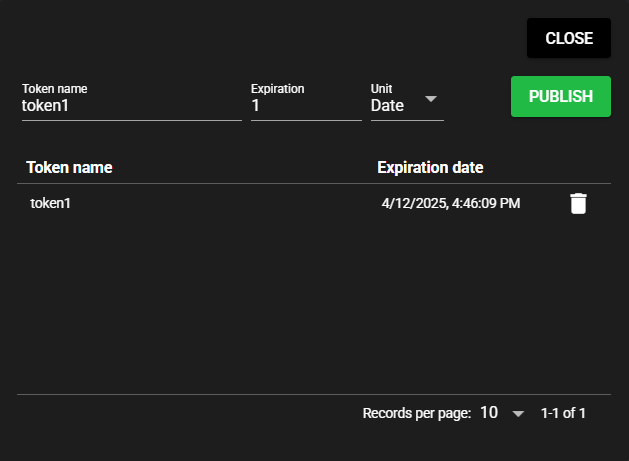
Input the following items and press "Publish".
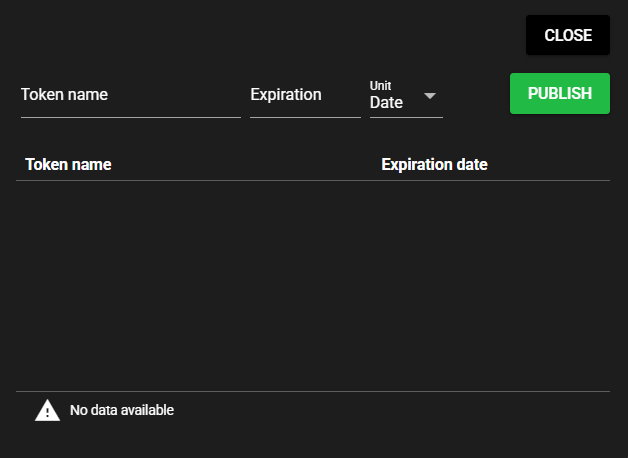
Item Description Token name Name to identify a token Expiration date Expiration date for the token About the expiration date of access tokens
If the expiration date for a token is set long, the security risk in the event of a token breach increases. Conversely, if the expiration date is set too short, security is enhanced, but the access token must be updated frequently. Depending on a predetermined operation policy, consider updating the access token regularly.
-
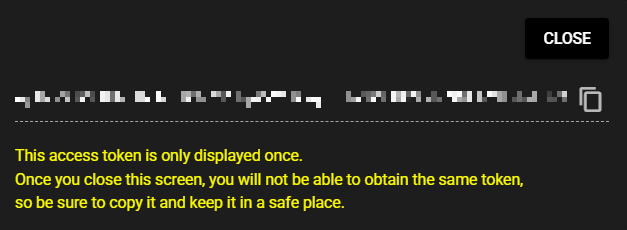
After copying a published access token, press "Close".
Storage of access token
The access token is displayed only once. The same token cannot be retrieved once this screen is closed, so be sure to make a copy.
-
Published access tokens are added to the list.
4.2.3.1.13 HTTP/HTTPS communication#
The user device and SpeeDBee Synapse HTTP communication can be configured by following the steps below.
-
Press the Setting Menu icon.
-
Select "HTTP/HTTPS communication".
-
Input the following items and press "Reflect and restart".

Item Description Bind address This is the address at which SpeeDBee Synapse accepts requests.
Note: In some environments, this setting cannot be changed/edited.Port This is the port at which SpeeDBee Synapse accepts requests.
Note: In some environments, this setting cannot be changed/edited.Encrypt communication Select ON to use encrypted communication (HTTPS).
Note: In some environments, this setting cannot be changed/edited.SSL/TLS certificates This is a digital certificate used for encryption.
Note: The certificate needs to be obtained from the certificate authority (CA).Secret key This is a secret key linked to the SSL/TLS certificate.
Note: The secret key needs to be obtained from the certificate authority (CA). -
The whole system is restarted to reflect configurations. After restarting, SpeeDBee Synapse can be accessed with the URL that matches the settings.
https://< Host name or IP address of the device>:< This is the port at which SpeeDBee Synapse accepts requests.>/http://< Host name or IP address of the device >:< This is the port at which SpeeDBee Synapse accepts requests.>/
4.2.3.1.14 Proxy Settings#
This section describes the operation of Proxy Settings. The proxy information set here can be referenced from the settings of each component, and its communication can be route through a proxy.
Proxy-Compatible Components
By setting a default proxy, communication for specific operations will be routed through the proxy.
Operations Affected
Add
Proxy settings can be added by following the steps below.
-
Press the Setting Menu icon.
-
Select "Proxy Settings".
-
Select "ADD".

-
Input the following items and press "SAVE".

Item Description Server name An optional name to identify the server.
Note: Components configured to communicate via a proxy reference the server name to load their settings. Therefore, if the server name is changed, the components must be reconfigured.Protocol Type of proxy to use.(HTTP) Host Host name or IP address of the proxy server. Port Port number of the proxy server. Authentication method Proxy server authentication method. (No Authentication, Basic Authentication) Username Username for Basic Authentication. Password Password for Basic Authentication. -
The saved setting will be added to the list.

Edit
Proxy settings can be edited by following the steps below.
-
Press the Setting Menu icon.
-
Select "Proxy Settings".
-
Select the edit icon.
-
Input the following items and press "SAVE".
Item Description Server name An optional name to identify the server.
Note: Components configured to communicate via a proxy reference the server name to load their settings. Therefore, if the server name is changed, the components must be reconfigured.Protocol Type of proxy to use.(HTTP) Host Host name or IP address of the proxy server. Port Port number of the proxy server. Authentication method Proxy server authentication method. (No Authentication, Basic Authentication) Username Username for Basic Authentication. Password Password for Basic Authentication.
Default Proxy
Default proxy can be set by following the steps below.
-
Press the Setting Menu icon.
-
Select "Proxy Settings".
-
Select the proxy to set as the default.
Note: Pressing a proxy that is set as the default will unset it, leaving no default proxy configured.

Delete
Proxy settings can be deleted by following the steps below.
-
Press the Setting Menu icon.
-
Select "Proxy Settings".
-
Press the delete icon.
Note: If a deleted proxy setting was being referenced by a component, the component will need to be reconfigured.
4.2.3.1.15 Download execution license configuration#
Configuration can be downloaded for the execution license environment. For details, see Execution license.
4.2.3.1.16 Software Information#
Software information can be confirmed by following the steps below.
-
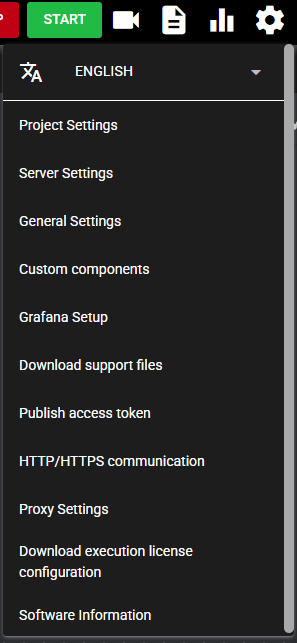
Press the Setting Menu icon.
-
Select "Software Information".
-
You can verify software and system information and register licenses.
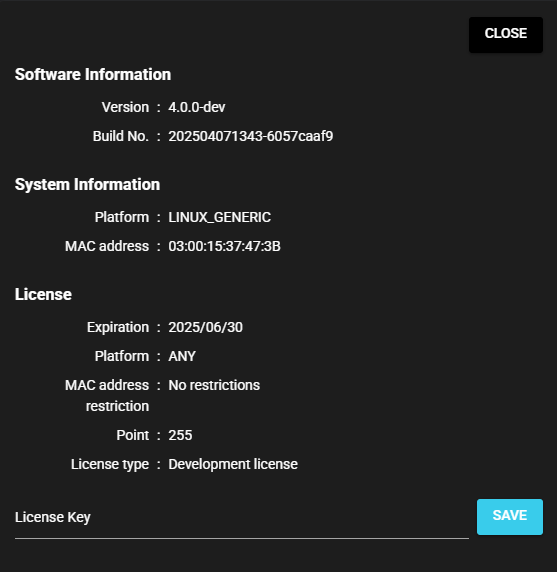
Item Description License Information Verify and register license information Software Information Version The version of SpeeDBee Synapse Build Number The build number of SpeeDBee Synapse System Information Platform Operating Equipment Platform MAC address Operating Equipment MAC address
4.2.3.1.17 License Information#
License information can be confirmed and registered by following the steps below.
-
Click “License Information” in Software Information.
-
The following items will be displayed.

Item Description License Information Expiration The expiration date of the registered license Platform The platform that the registered license supports MAC address restriction MAC addresses that the registered license supports Point Points granted for registered licenses License type The registered license type File Identifier Identifier of the registered license file
※Not displayed if not applied via file.
Registration
Licenses can be registered using two methods: file or key.
-
Register by file
-
Press the “Apply File” button.
-
Select the license file.
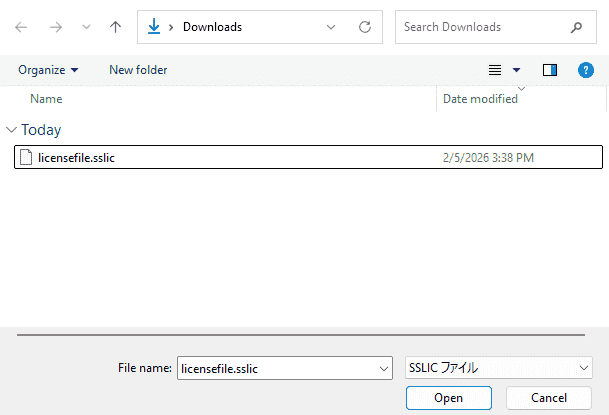
-
-
Register with Key
-
Enter the license key in the input field.
-
Click “Apply Key”.
-
Once the license is registered using either method, the license information will appear on the screen.
4.2.3.1.18 About Points#
Points to use various functions are given to each SpeeDBee Synapse license. When SpeeDBee Synapse functions are used, the corresponding number of points is consumed.
Notes on Data Flow Controller and OMRON-SBS for Windows editions
Data Flow Controller and OMRON-SBS for Windows editions can use points without limitation.
However, this does not guarantee unlimited operation. Performance may be affected by your hardware specifications, running applications, and related systems.
If the points are 0, no points are consumed.
If the point is 2, two points are consumed if the configuration is saved and operated.
Also, when the same function is used simultaneously, the number of points consumed remains two points.
For example, even when two MQTT Emitters are used, the number of points consumed remains two.
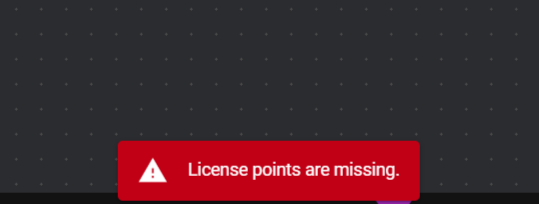
If there is a shortage of points for functions to run simultaneously, the component operation is disabled.
Cautions when using the same function at the same time
When the same function is used simultaneously, the number of points consumed remains the same. However, this does not guarantee operations without limit. This is affected by the specifications of the hardware in use, applications to use, and related systems.
4.2.3.2 User Management#
This section describes user management operations.
4.2.3.2.1 Add#
Users can be added by following the steps below.
-
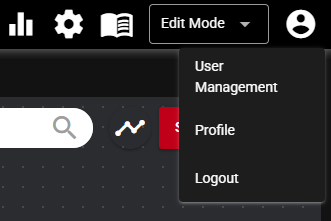
Press the User Management icon.

-
Select "User Management".
-
Press "Add".
-
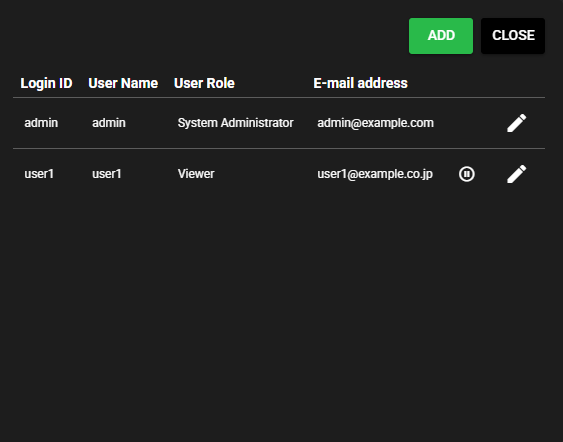
Input the following items and press "Save".
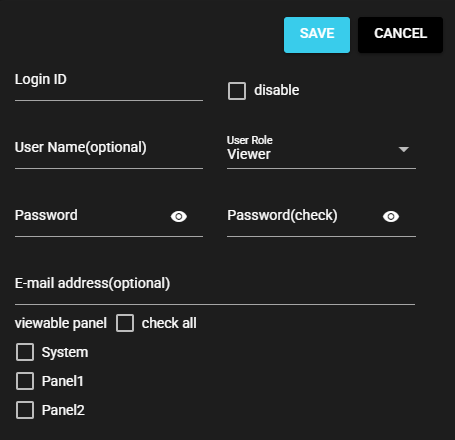
Item Description Disable Checking this disables a user, preventing them from logging in. Login ID ID to enter when logging in Username Name assigned to a user (optional) User Role System administrator: Can perform all operations. This role is granted to the initial user "admin", and at least one administrator is required.
Manager: Can perform all operations. System administrators cannot be added, updated, or deleted.
Operator: Can view Run Mode and start and stop components.
Viewer: Can view Run Mode.Password Password to enter when logging in E-mail address E-mail address to be linked to the user (Optional) Viewable panel Panels that can be viewed by users (This is set only when the user role is Operator or viewer.) -
The user is added.
4.2.3.2.2 Edit#
The user information can be edited by following the steps below.
-
Press the User Management icon.
-
Select "User Management".
-
Press the edit icon of the user to edit.
-
Edit the following items and press "Save".
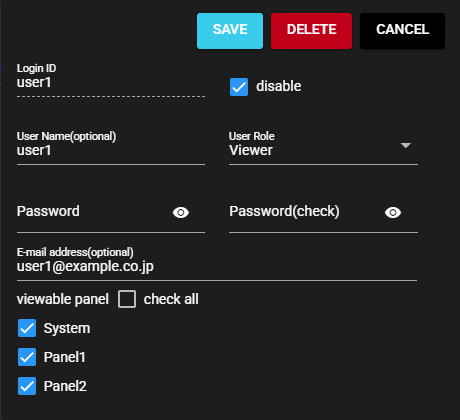
Item Description Disable Checking this disables a user, preventing them from logging in. Login ID ID to enter when logging in Username Name assigned to a user (optional) User Role System administrator: Can perform all operations. This role is granted to the initial user "admin", and at least one administrator is required.
Manager: Can perform all operations. System administrators cannot be added, updated, or deleted.
Operator: Can view Run Mode and start and stop components.
Viewer: Can view Run Mode.Password Password to enter when logging in E-mail address E-mail address to be linked to the user (Optional) Viewable panel Panels that can be viewed by users (This is set only when the user role is Operator or viewer.) -
The edited content is saved.
4.2.3.2.3 Delete#
Users can be deleted by following the steps below.
-
Press the User Management icon.
-
Select "User Management".
-
Press the edit icon of the user to delete.
-
Press "Delete".
-
The user is deleted.
About the System Administrator
At least one system administrator is required. If there is only one system administrator, it cannot be deleted.
4.2.3.2.4 Profile#
The information of a user that is currently logged in can be checked by following the step below.
-
Press the User Management icon.
-
Select "Profile".
-
The following items are displayed for the user who is currently logged in.
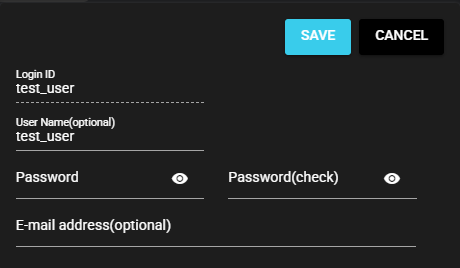
Item Description Login ID ID to enter when logging in Username Name assigned to a user (optional) Password Password to enter when logging in E-mail address E-mail address to be linked to the user (Optional) -
After editing the items and clicking "Save", the edited version is saved.
4.2.3.2.5 Login#
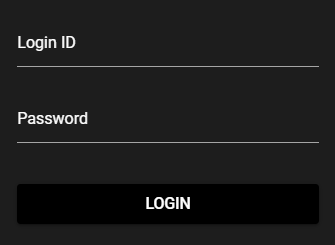
Users can log in to SpeeDBee Synapse by following the steps below.
-
Go to "http://{ IP address of the environment where SpeeDBee Synapse is running }:8120".
-
Input the user's "login ID" and "password" and press "login".
-
Log the user in to SpeeDBee Synapse.
4.2.3.2.6 Logout#
Users can log out of SpeeDBee Synapse by following the steps below.
-
Press the User Management icon.
-
Select "Logout".
-
This logs the user out of SpeeDBee Synapse.
4.2.3.3 Panel#
This section describes panel operations.
About panel browsing permissions
Users who are operators or viewers can set browsing user roles for individual panels through the User Management configurations. Using multiple panels, different flows from data collection to output and integration can be created, and only selected panels can be displayed to operators and viewers.
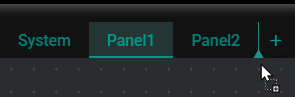
4.2.3.3.1 Add#
Panels can be added by following the steps below.
-
Press the + icon on the tab menu of the panel.
-
The panel is added.

This operation can be performed only in Edit Mode.
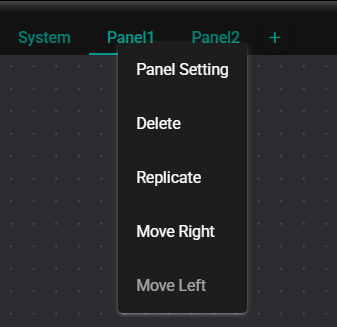
4.2.3.3.2 Changing a name#
Panel names can be changed by following the steps below.
-
Right-click a panel tab.
-
Select "Panel Settings".
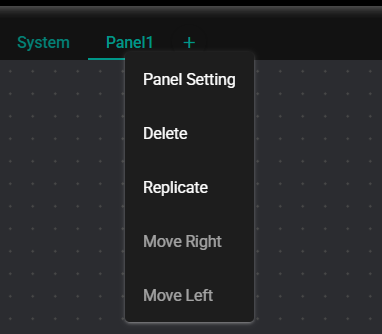
-
Input the panel name and press "Save".
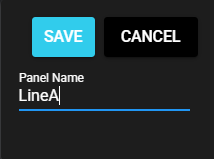
-
The panel name changes to the entered input.
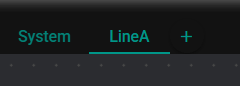
This operation can be performed only in Edit Mode.
4.2.3.3.3 Rearranging#
Panels can be rearranged by following either of the steps below.
-
Rearranging from the panel tab context menu
-
Right-click a panel tab.
-
Select "Move Right" or "Move Left".
-
The panels are rearranged.
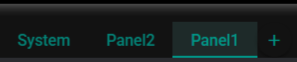
-
-
Rearranging by dragging and dropping the panel tab
-
Drag a panel tab.
-
Drop it at the place where you want to move the panel.
-
The panels are rearranged.
-
This operation can be performed only in Edit Mode.
4.2.3.3.4 Delete#
Panels can be deleted by following the steps below.
-
Right-click a panel tab.
-
Select "Delete".
-
The panel is deleted.
This operation can be performed only in Edit Mode.
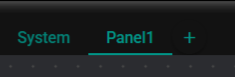
4.2.3.3.5 Replicate#
Panels of the same configurations can be replicated by following the steps below.
-
Right-click a panel tab.
-
Select "Replicate".
-
A panel with the same configurations of the original is replicated.
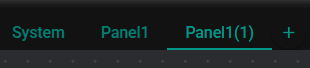
This operation can be performed only in Edit Mode.
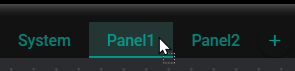
4.2.3.3.6 Display#
Panels can be displayed by following the steps below.
-
Click the tab of the panel to display.
-
The panel whose tab is clicked is displayed.
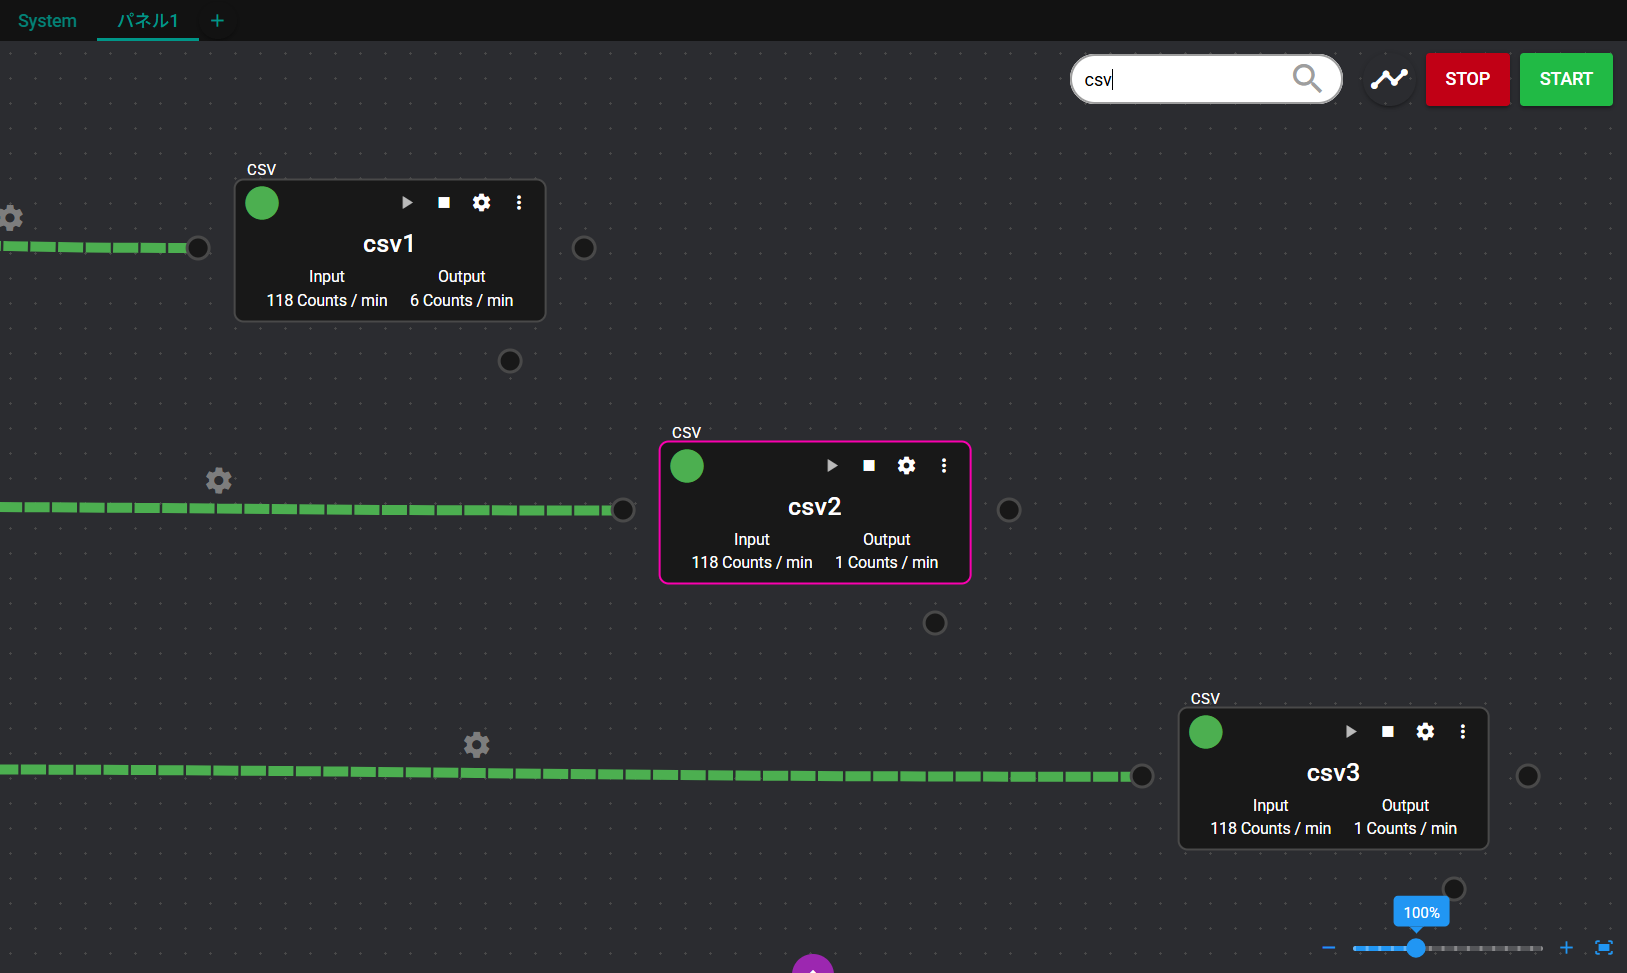
4.2.3.3.7 Component Search#
The location of components registered in the panel can be searched by following the steps below.
-
Input the component name in the search box at the top right of the panel.
-
Select from the suggestions.
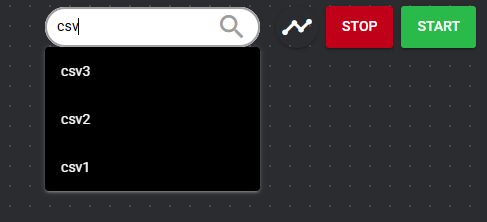
-
The selected component is displayed in the center of the panel.
4.2.3.3.8 Adjusting the display magnification#
The display magnification of the panel can be adjusted by following the steps below.
-
The current magnification of the panel is displayed at the bottom right of the panel.
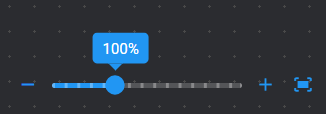
-
Move the slider in the + direction to enlarge the display to fullscreen, and move it in the – direction to reduce the display.
-
Pressing + enlarges the display magnification by 5%, and pressing - reduces the display magnification by 5%.
-
Pressing the Overall Display button shows the entire component arranged on the panel on the screen.
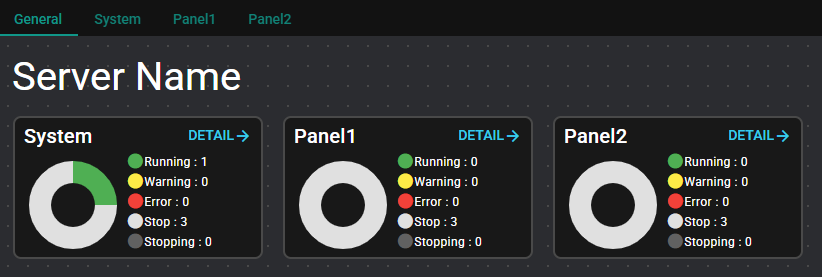
4.2.3.3.9 Overall Panel#
The entire panel can be displayed by following the steps below. The entire panel shows the information of individual panels.
-
Select "General" in the panel tab.
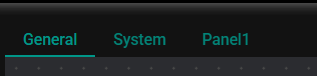
-
This displays the server instance name, panel list, and operation status of individual panel component.
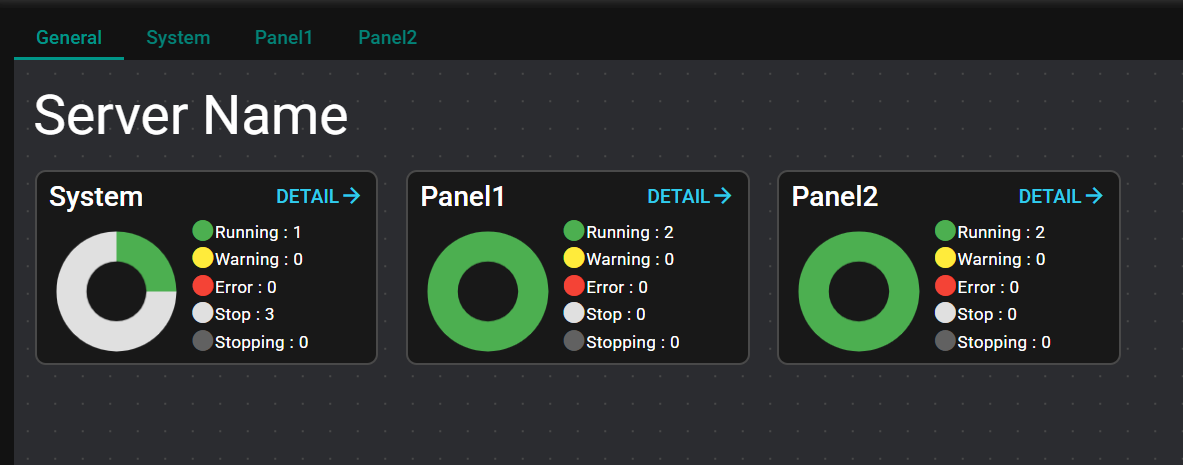
-
Press "DETAIL" to go to each panel.
This operation can be performed only in Run Mode.
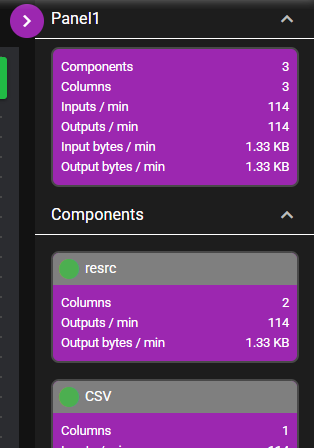
4.2.3.3.10 Panel Status#
For each panel, the following information is displayed.
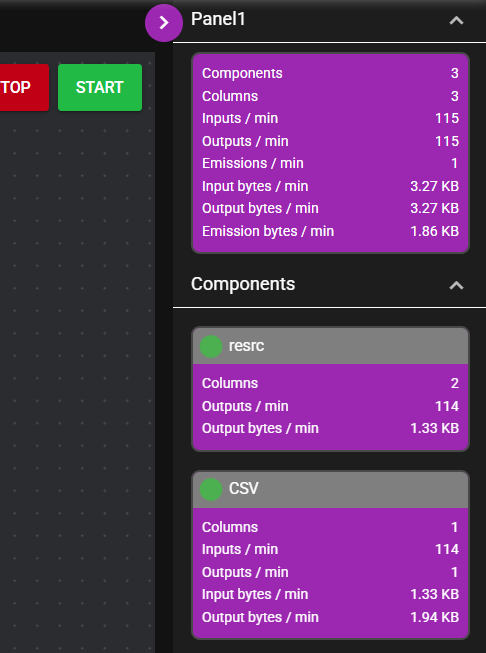
| Item | Description |
|---|---|
| Number of components | Number of all components on the panel |
| Number of columns | Number of all component columns on the panel |
| Inputs / min | The total number of data inputs per minute for all components on the panel |
| Outputs / min | The total number of data outputs per minute for all components on the panel |
| Receives / min | The total number of data received per minute for all components on the panel |
| Emissions / min | The total number of data emitted per minute for all components on the panel |
| Input bytes / min | The total number of input bytes per minute for all components on the panel |
| Output bytes / min | The total number of output bytes per minute for all components on the panel |
| Receive bytes / min | The total number of received bytes per minute for all components on the panel |
| Emission bytes / min | The total number of emission bytes per minute for all components on the panel |
The following information is displayed for operating components on the panel.
| Item | Description |
|---|---|
| Number of columns | Number of data items that component outputs |
| Inputs / min | Number of data inputs per minute |
| Outputs / min | Number of data outputs per minute |
| Receives / min | Number of data received per minute |
| Emissions / min | Number of data emitted per minute |
| Input bytes / min | Number of data inputs bytes per minute |
| Output bytes / min | Number of data output bytes per minute |
| Receive bytes / min | Number of data reception bytes per minute |
| Emission bytes / min | Number of data emission bytes per minute |
This operation can be performed only in Run Mode.
4.2.3.4 Component#
This section describes component operations.
4.2.3.4.1 Add#
Components can be added by following the steps below.
-
Select a component from the left menu and drag the icon.
-
Drop it on top of the panel.
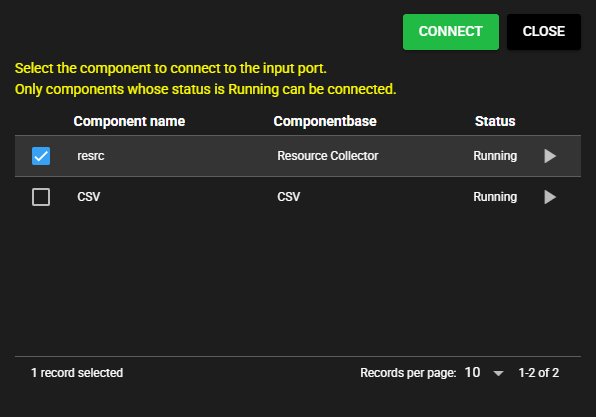
-
For some components, the dialog is displayed to select a component to connect to the IN Port. Select the component to connect and press "Select".
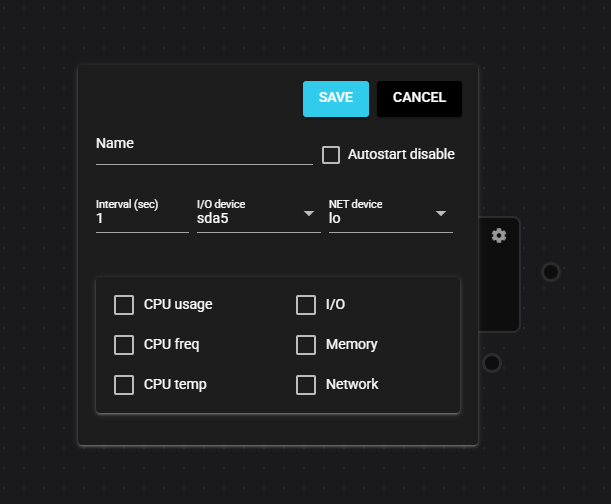
-
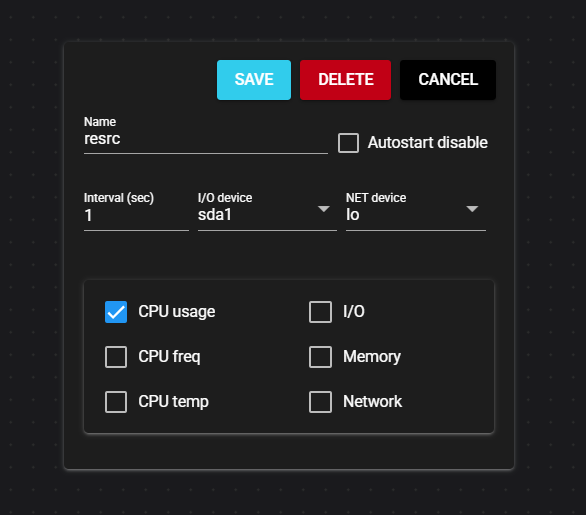
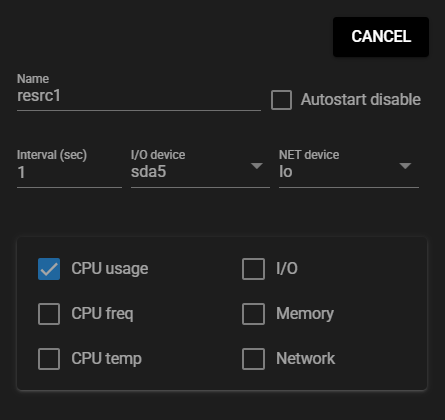
A configuration dialog opens. Input configuration items there and press "Save".
-
The component is added to the panel.
This operation can be performed only in Edit Mode.
4.2.3.4.2 Edit#
Component configurations can be edited by following the steps below.
-
Press the Configuration icon of the component.
-
A configuration dialog opens. Edit configuration items there and press "Save".
-
The edited version is saved.
This operation can be performed only in Edit Mode.
4.2.3.4.3 Delete#
Components can be deleted by following the steps below.
-
This is how to delete a component from the configuration icon of the component.
-
Press the Configuration icon of the component.
-
The configuration dialog opens. Press "Delete".
-
The component is deleted.
-
-
This is how to delete a component using its context menu of the component.
-
Right-click on the component and select "Delete".
-
The component is deleted.
-
This operation can be performed only in Edit Mode.
4.2.3.4.4 Copy & Paste#
Components of the same configurations can be replicated by following the steps below.
-
Copy the component using one of the following ways.
-
Right-click on the component and select "Copy".
-
While clicking to select the component, press the "C" key while holding down the "Ctrl" key on the keyboard.
-
-
Paste the component in one of the following ways.
-
Right-click the panel and select "Paste".
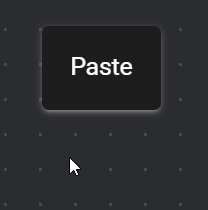
-
Press the "V" key while holding down the "Ctrl" key on the keyboard.
-
-
A component with the same configurations as the copied one is created.
This operation can be performed only in Edit Mode.
4.2.3.4.5 Multiple Select#
Multiple components can be selected by clicking each component while holding down the "Ctrl" key on the keyboard.

After selecting multiple components, components selected from the context menu or through keyboard operation can be Copied & Pasted or Deleted.

To deselect multiple components, click anywhere in the panel except the component.

This operation can be performed only in Edit Mode.
4.2.3.4.6 Confirming configurations#
Component configurations can be confirmed by following the steps below.
-
Press the Configuration icon of the component.
-
A dialog opens and displays component configuration items and configuration values.
This operation can be performed only in Run Mode.
4.2.3.4.7 Component status#
Component operation status can be checked by following the steps below.
-
Status
The status light displays the operational status of the component. For detail about the status, see Status List.
-
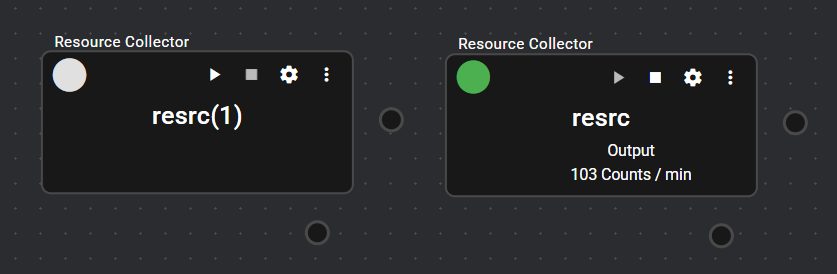
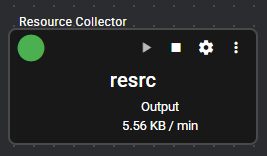
Data volume
This displays the volume of data for the following components.
- Input and output data per minute
- Emission and reception data per minute
Click this to switch between displaying the number of data and the number of bytes.

4.2.3.4.8 Start/Stop#
Components can be started/stopped by following the steps below.
(All components)
-
Press the "Start" button on the header.

-
This starts all data collection flows registered in SpeeDBee Synapse.
-
Press the "Stop" button on the header.
-
This stops all data collection flows registered in SpeeDBee Synapse.
(Panel Unit)
-
Press the "Start" button on the panel.

-
This starts the operation of the data collection flow registered in the panel.
-
Press the "Stop" button on the panel.
-
This stops the operation of data collection flow registered in the panel.
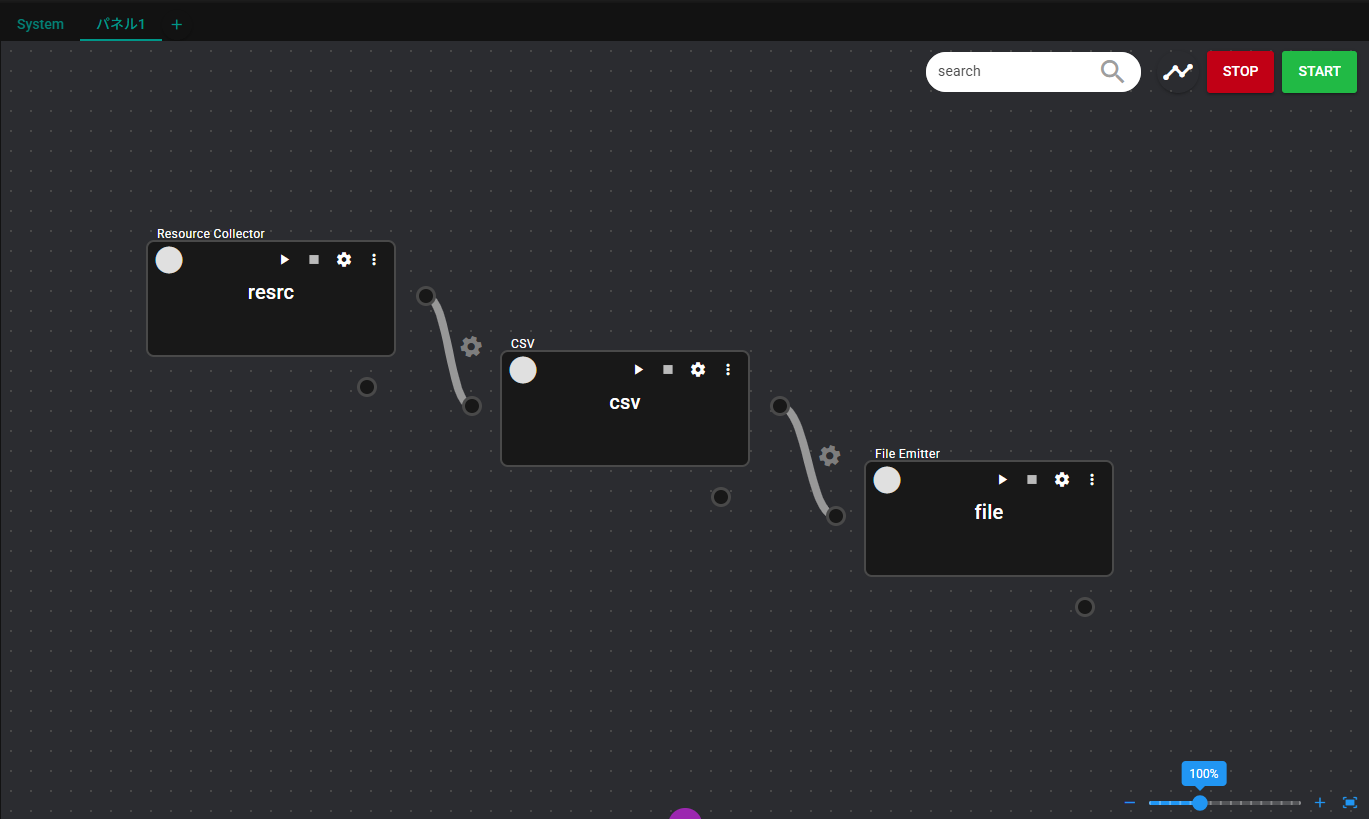
(Component Unit)
-
Press the Start icon of the component.
-
This starts the component and begins processing.
-
Press the Stop icon of the component.
-
This stops the component and ends processing.
Users with the viewer role cannot start or stop components.
4.2.3.4.9 Display manual for component to operate#
When the component to operate is on the display, the manual for the target screen can be shown.
- Press the Manual icon when the component is displayed.

- The manual for the component to operate opens in a separate window.
4.2.3.5 Flowlink#
This section describes flowlink operations.
This operation can be performed only in Edit Mode.
4.2.3.5.1 Add#
Flowlink can be added by following the steps below.
-
Drag the OUT Port or SYSTEM Port of the component.
-
Release the mouse button on the IN Port of another component.
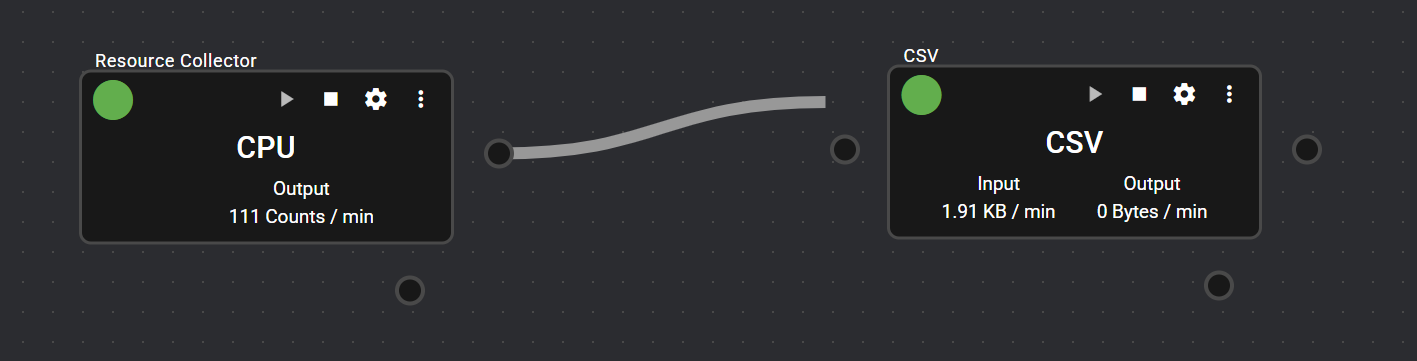
-
This adds a flowlink between these components.
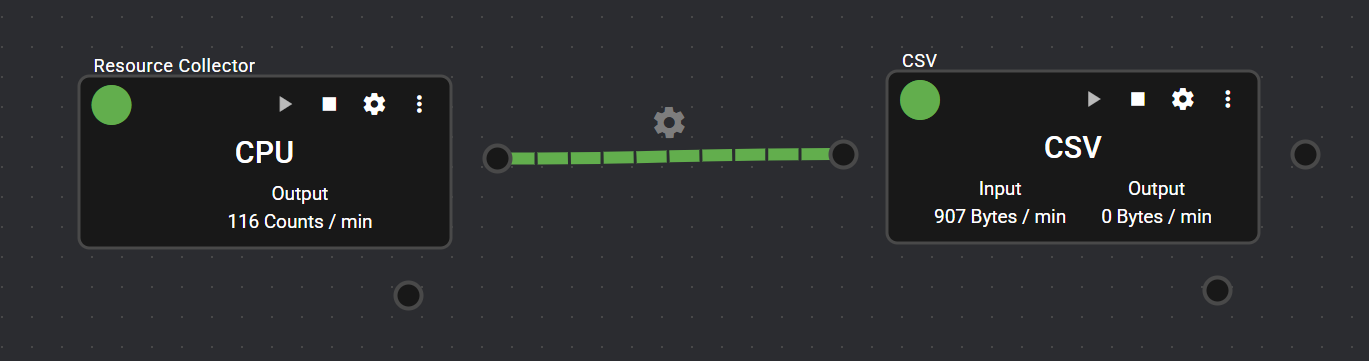
4.2.3.5.2 Filter#
Left-clicking the flow link icon or right-clicking the flow link allows filter configuration.
Configuration can restrict the data flowing through the flow link. For more details, see “Filter”.
4.2.3.5.3 Delete#
Flowlink can be deleted by following the steps below.
-
Right-click the flow link or left-click the icon.
-
Select "Flowlink Delete".

-
The flowlink is deleted.
4.2.3.6 Data monitor#
By clicking the port of the component, the data that is flowing to the port can be checked on the data monitor.
4.2.3.6.1 Change configurations#
Change types
The data monitor types can be changed by following the steps below.
-
Click on the data monitor display type selection form.

-
Select a type.
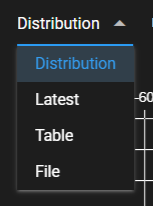
-
The data monitor of the selected type is displayed.
Configure thinning interval
The data monitor displays data by thinning them at specified intervals.
When the thinning interval is input in "Thinning interval(ms)", it is reflected in the data monitor.
Configure delay time
The data monitor displays the latest value as the current time minus the "delay time(ms)".
When the value is input in "Delay time(ms)", it is reflected in the data monitor.
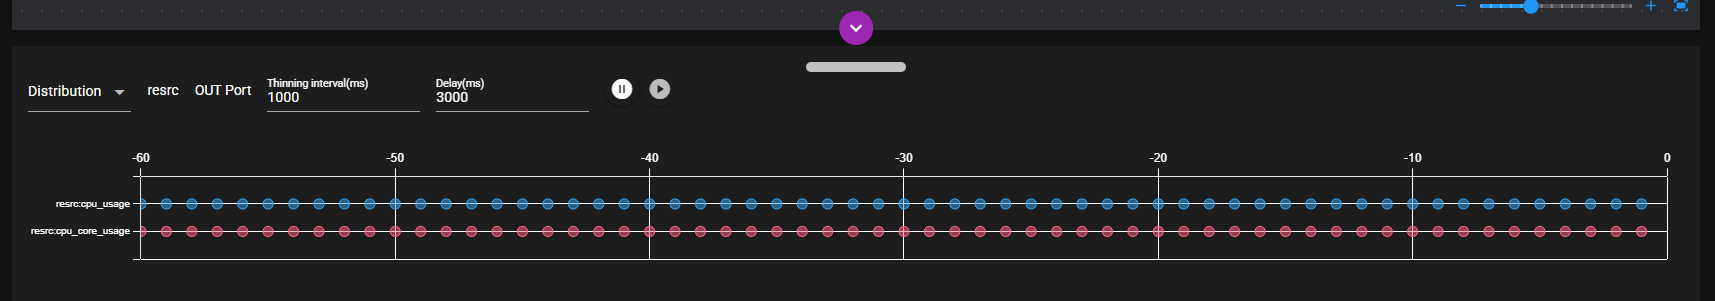
4.2.3.6.2 Distribution#
The graph displays the data flowing through the port over a one-minute period. The graph displays the following information.
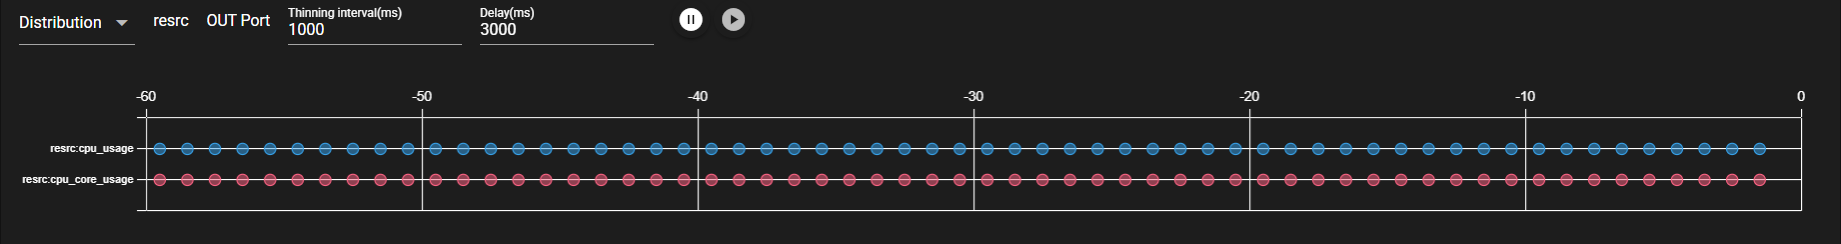
| Item | Description |
|---|---|
| Horizontal axis | Time 0 is the current time minus the "Delay time(ms)", and -x is the time x seconds before that time. |
| Vertical axis | Data item name |
| Point | Data |
When the cursor is placed on the point, the data content and the time at which the data flowed are displayed.

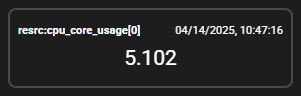
4.2.3.6.3 Latest value#
The following information is displayed for all data items on the port.
- Latest value
- Time at which the latest value flowed
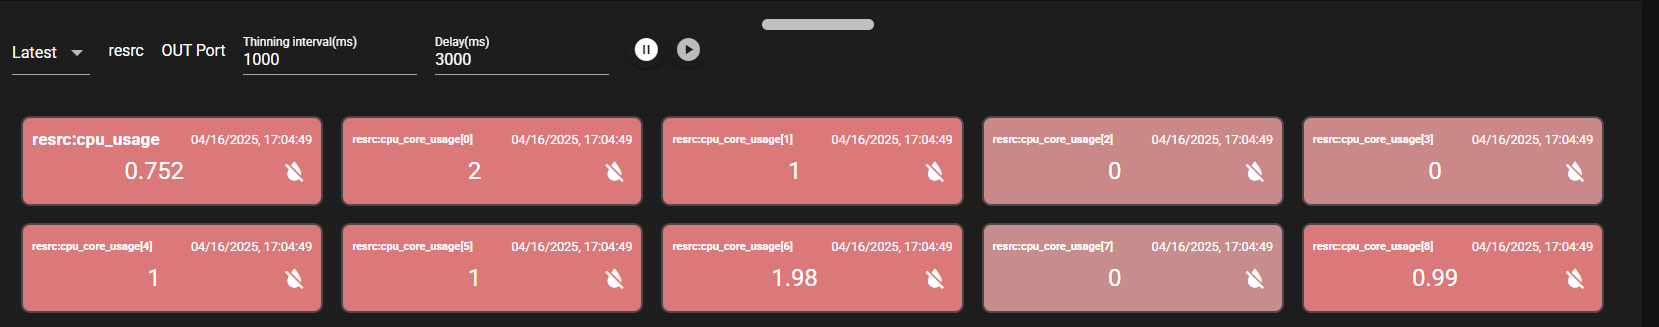
When data values are changed, they are displayed in red.
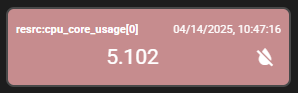
Pressing the Clear button restores the data items that have turned red to their original colors.
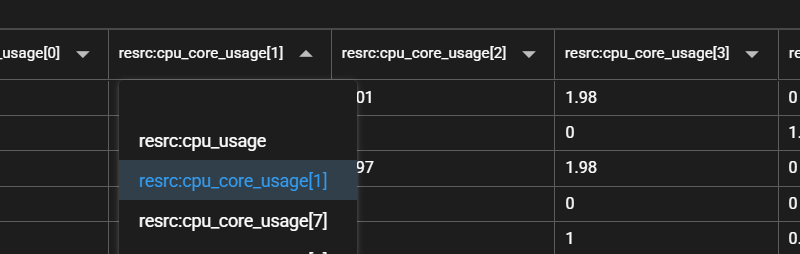
4.2.3.6.4 Table#
The data that flowed into the port are displayed in table format. The table displays the following information. The number of table rows displayed per page is automatically adjusted according to the height of the data monitor.
| Item | Description |
|---|---|
| Columns | Data item name The maximum number of columns is 8. |
| Row | Time at which the data flowed The maximum number of rows is 100. |
| Content | Data |
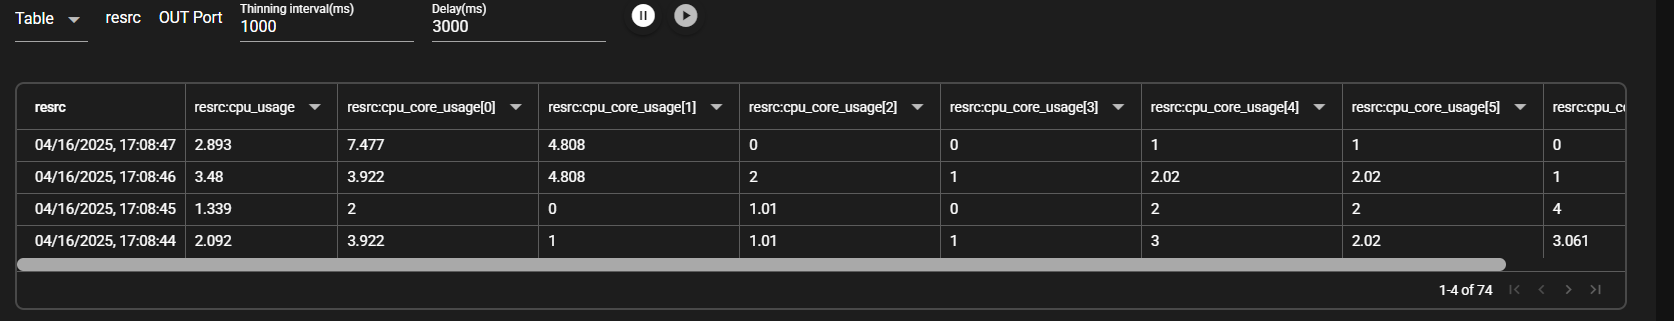
If the table contains more rows than can fit on one page, pages can be switched.
If there are more than eight data items on a port, selecting a column heading in the table changes the data items displayed in that column. When blank is selected, the corresponding section is not displayed.
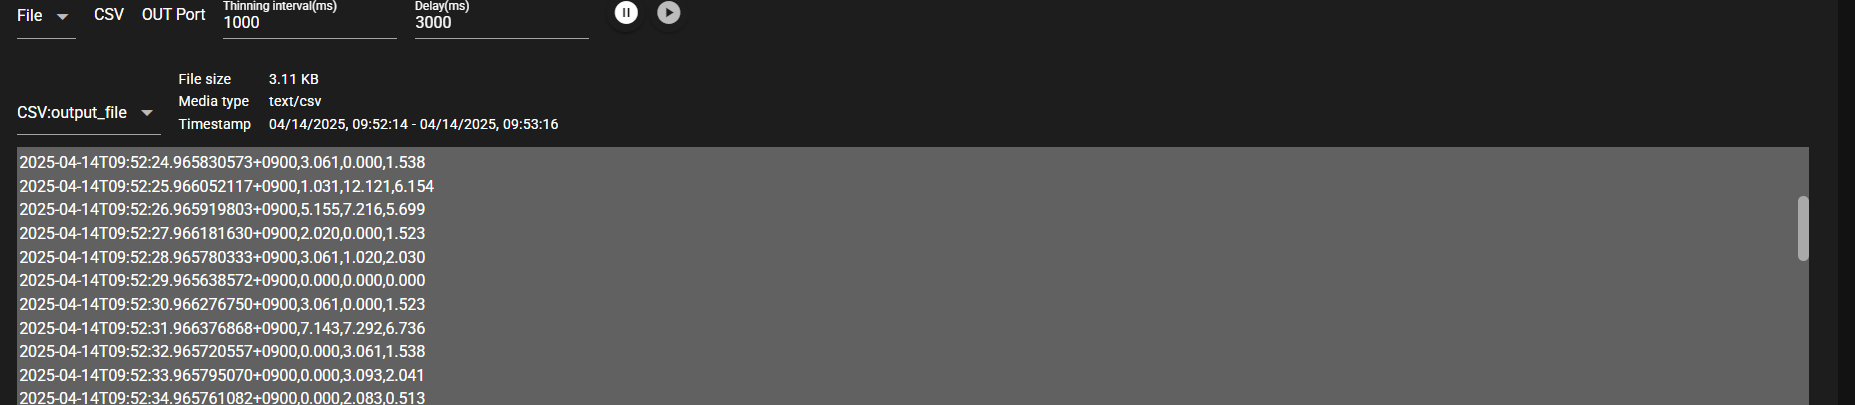
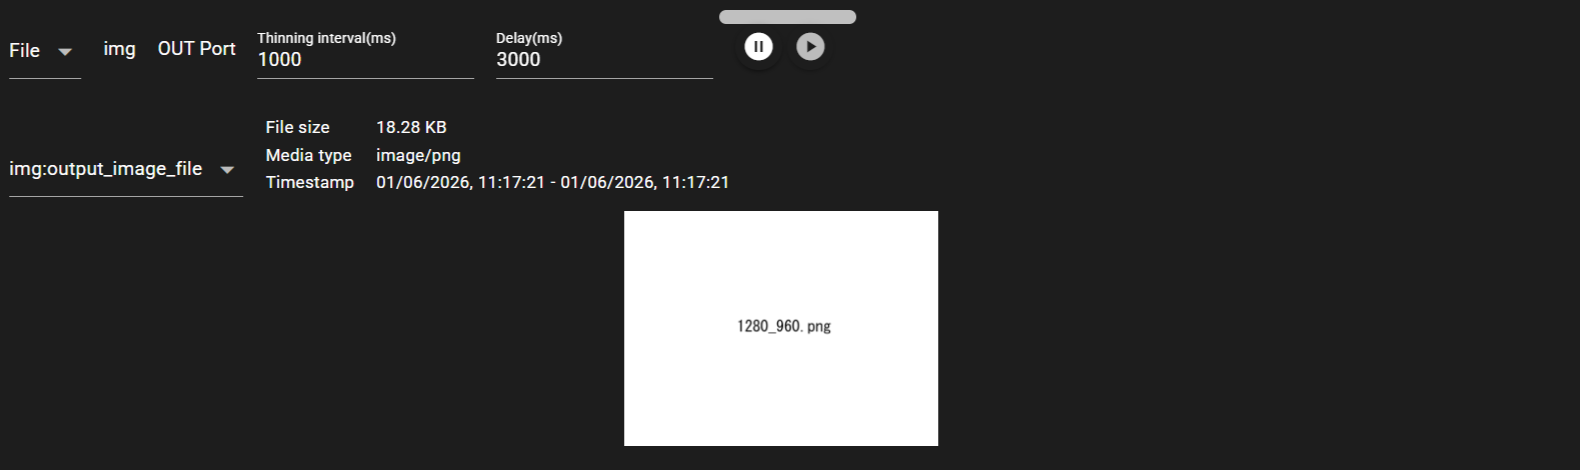
4.2.3.6.5 File#
If the data is in a file format, the following file information is displayed.
- File size ... Size of the file.
- Media type ... Media type of the file.
- Timestamp ... Time range of the data contained in the file
- File content
| Item | Description |
|---|---|
| Text Content | Text is displayed in a monospaced font. If all data cannot be displayed within the view area, horizontal and vertical scroll bars are available for navigation. |
| Image Content | Images are automatically scaled up or down to fit within the display area while preserving their aspect ratio. Images smaller than the display area are shown at their original size. Note that supported image formats depend on the browser’s rendering capabilities. Please check which image formats are supported by your browser. |
Supported Image Formats in the Data Monitor
Supported image formats depend on the browser’s rendering capabilities. As a result, images in formats other than common ones such as JPG, PNG, and GIF (for example, HEIF) may not be displayed in some browsers. Please verify which image formats are supported by your browser.
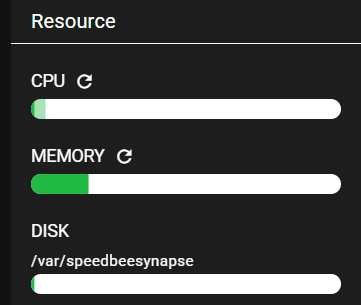
4.2.3.7 System resources#
This section describes system resources.
This operation can be performed only in Run Mode.
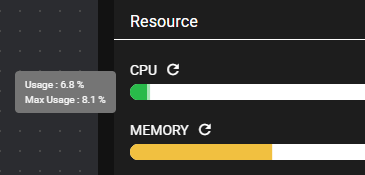
4.2.3.7.1 CPU#
When the cursor is placed on the gauge, the following information is displayed.
| Item | Description |
|---|---|
| Usage | The current CPU usage of SpeeDBee Synapse |
| Max Usage | The maximum CPU usage of SpeeDBee Synapse |
The dark portion of the gauge represents the current CPU usage and the light portion represents the maximum CPU usage that has been reached during operation.
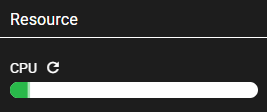
The gauge changes color according to the percentage of CPU usage, as shown in the table below.
| Percentage | Color |
|---|---|
| 0~40 | Green |
| 40.1~70 | Yellow |
| 70.1~100 | Red |
Pressing the Refresh icon resets the Max Usage.
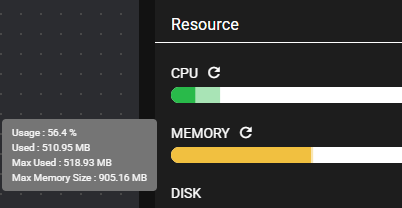
4.2.3.7.2 MEMORY#
When the cursor is placed on the gauge, the following information is displayed.
| Item | Description |
|---|---|
| Usage | The current memory usage of SpeeDBee Synapse |
| Used | The current memory being used in SpeeDBee Synapse |
| Max Used | The max value of the memory usage of SpeeDBee Synapse |
| Max Memory Size | Memory size of the entire system |
The colored portion of the gauge represents memory usage.
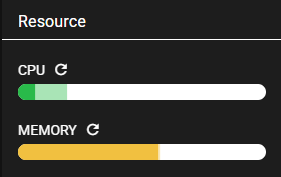
The gauge changes color according to the percentage of memory usage, as shown in the table below.
| Percentage | Color |
|---|---|
| 0~40 | Green |
| 40.1~70 | Yellow |
| 70.1~100 | Red |
Pressing the Refresh icon resets the Max Used.
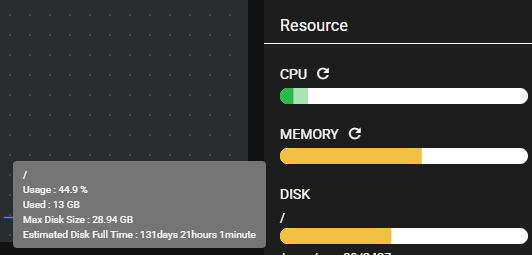
4.2.3.7.3 DISK#
When the cursor is placed on the gauge, the following information is displayed.
| Item | Description |
|---|---|
| Usage | The current ratio of disk usage in SpeeDBee Synapse compared to the Max Disk Size |
| Used | The current disk being used in SpeeDBee Synapse |
| Max Disk Size | Maximum amount of disk space available for SpeeDBee Synapse |
| Estimated Disk Full Time | Estimated time for the disk used to reach maximum disk capacity, based on the 1-minute increase in disk used Note: This is not displayed if there is no increase in disk used |
The colored portion of the gauge represents disk usage.

The gauge changes color according to the percentage of disk usage, as shown in the table below.
| Percentage | Color |
|---|---|
| 0~40 | Green |
| 40.1~70 | Yellow |
| 70.1~100 | Red |
4.2.3.8 Control the selected components#
Control the Selected components is a function that controls the selected components in List Mode. Operations such as start, stop, toggle autostart, toggle simulation mode, and select log level can be performed collectively on the selected components.
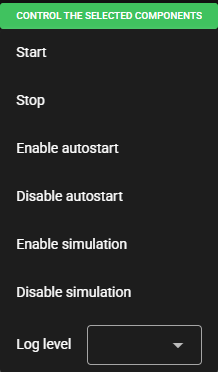
-
Start
Starts the selected components collectively. Starts regardless of the autostart setting.
-
Stop
Stops the selected components collectively.
-
Enable autostart
Enables autostart for the selected components collectively.
-
Disable autostart
Disables autostart for the selected components collectively.
-
Enable simulation
Enables simulation for the selected components collectively.
-
Disable simulation
Disables simulation for the selected components collectively.
-
Log level
Changes the log level of the selected components collectively.
4.2.3.9 Component list control#
Component list control is a function that controls components from the component list in List Mode. Operations such as start, stop, log viewing, and editing can be performed on the component list.
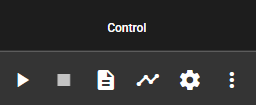
-
Start
Starts the component.
-
Stop
Stops the component.
-
Log
Opens the log dialog of the component.
-
Status Timeline
Opens the status timeline dialog of the component.
-
Configuration
Opens the configuration dialog of the component.
-
Port settings
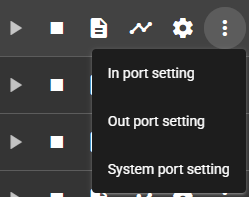
-
In port setting
Opens the in port setting dialog of the component.
-
Out port setting
Opens the out port setting dialog of the component.
-
System port setting
Opens the system port setting dialog of the component.
-
4.2.3.10 Simulation mode#
This section describes the simulation mode.
4.2.3.10.1 Outline of simulation mode#
The simulation mode is a function that generates columns based on the contents of a CSV file and registers dummy data. This function enables configurations and operation verification even in an environment where there is no actual opposed equipment (such as PLC). Components that support simulation mode are as follows.
- Modbus Collector
- PLC Collector
- EtherNet/IP Collector
- MQTT Collector
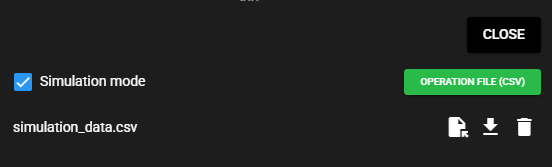
4.2.3.10.2 Configuration and switching of simulation mode#
This section describes using the PLC collector.
-
Click the Simulation settings button in the upper left of the component configuration window.

-
The simulation settings window opens. Input configuration items and click "Close".

Item Description Simulation mode Enable/disable simulation mode Operation file (csv) A CSV file that defines the columns and data used in simulation mode. For detail, see Formatting Driving Files. Once a driving file is uploaded, its configurations are retained until deleted.
-
The window returns to the component configuration window. Input component configuration items and click "Save". Changes to simulation settings are not applied until "Save" is clicked on the component configuration screen.
-
Click the Start button to start. The component status light turns blue when the system is running while the simulation mode is ON.

4.2.3.10.3 Operation File Format#
The operation file is in CSV format. This consists the header section (the first row) and the data section (the second row onward). The header section defines the columns, while the data section specifies the timestamps and data to register.
timestamp_ms,data1:bool,data2:int32,data3:string,data4:binary
        1000,      true,          1,       test1,    YWl1ZW8=
        2000,     false,          2,       test2,    YWl1ZW8=
        3000,      true,          3,       test3,    YWl1ZW8=
Header section
timestamp_ms,data1:bool,data2:int32,data3:string,data4:binary
- The first row of the header section is fixed as timestamp_ms, and column definitions are input starting from the second row onward.
- Column definitions specify column names and data types separated by a
:, such ascolumn name: data type. - For arrays, the number of arrays is enclosed in
[]to specify, such ascolumn name: data type [Array Size].
Data section
        1000,      true,          1,       test1,    YWl1ZW8=
        2000,     false,          2,       test2,    YWl1ZW8=
        3000,      true,          3,       test3,    YWl1ZW8=
- For the first row of the data section, input the value of timestamp_ms, and for the second row and onward, input data values to actually register.
- Data is registered based on the time elapsed from the start to the value of timestamp_ms. In the example of the above CSV, the data is registered at 1,000, 2,000, and 3,000 milliseconds rom the start.
- If timestamp_ms is less than the last value (back in time), no data is registered for that row.
- When the end of the file is reached, data returns to the beginning of the file and is registered from the beginning again.
- If the value of the data is blank, the data is not registered.
- Array data is specified by separating them with spaces.
| Available data types for specification | Remarks |
|---|---|
| bool | Specify using true, false, TRUE, or FALSE. |
| int8 | Specified in the range int8. Hex can be specified by adding 0x to the prefix. |
| int16 | Specified in the range of int16. Hex can be specified by adding 0x to the prefix. |
| int32 | Specified in the range int32. Hex can be specified by adding 0x to the prefix. |
| int64 | Specified in the range int64. Hex can be specified by adding 0x to the prefix. |
| uint8 | Specified in the range uint8. Hex can be specified by adding 0x to the prefix. |
| uint16 | Specified in the range of uint16. Hex can be specified by adding 0x to the prefix. |
| uint32 | Specified in the range uint32. Hex can be specified by adding 0x to the prefix. |
| uint64 | Specified in the range uint64. Hex can be specified by adding 0x to the prefix. |
| float | Specified in the float range. Hex can be specified by adding 0x to the prefix. |
| double | Specified in double range. Hex can be specified by adding 0x to the prefix. |
| string | When specifying special characters (such as , \n) in CSV, enclose them in ". The escape for " is ". |
| binary | Specified in Base64 format. |
A sample driving file is shown below.
4.2.3.10.4 Operation of simulation mode#
While the system is running on the simulation mode, only the dummy data is registered.
The data of communication with actual devices is not collected.
As for the component status while the simulation mode is running,
the status lamp is shown with blue, but the status is the same as regular Running.
-
The registered dummy data can be checked through data monitoring in the same way as normal components.

-
Data can also be transferred to a different component by connecting flowlink.

Simulation mode poses no problem when validating data flows during development. However, be sure to turn it OFF when operating in an actual environment.
4.2.3.11 How to operate on a table device#
SpeeDBee Synapse supports operation on a tablet device. The verified tablet devices are as follows.
| Model name/model | OS version | Browser |
|---|---|---|
| iPad(A16) | iOS 18.5 | Safari 605.1.15 |
| HP Spectre x360 Convertible 14-ea0xxx | Windows 11 24H2 | Google Chrome 136.0.7103.114 |
Some actions on a tablet device differ from operation on a PC using a mouse. The main differences are summarized below.
| Function and operation | Operating on PC | Operation on a tablet |
|---|---|---|
| Context menu | Right-click | Long tap (hold) on a target element. |
| Drag & drop | Dragging with the mouse | Tap an object with a finger and drag it by moving your finger. |
| Hovering | Information is displayed by moving a mouse over it. | Hovering is not supported on devices with touch panels. However, some operations can be performed by tapping or long-tapping. |